AI Visibility (GEO): report and prompts
How AI Visibility works — which AI assistants are tested (Google AI Overview, AI Mode, ChatGPT, Gemini, Perplexity), how prompts are configured (topic-first flow, Prompt Research or manual), how to read the Monitored Prompts page report (6 stat cards with Share of Voice and AI Authority, Mentions/Overlap/SoV trends, per-source history trend, prompt × source table with AIO/Brand/Link, ⏳ and ⚠ markers) and suggested FAQs for GEO.
AI Visibility measures whether and how your brand is cited by AI assistants (Google AI Overview, AI Mode, ChatGPT, Gemini, Perplexity). More and more users ask “what’s the best X?” to an AI instead of Google: if the AI ignores you, you lose traffic even with a well-optimised site.
The 5 monitored sources
For each configured prompt, Miraqo queries 5 sources, one after the other:
- AI Overview — Google AI Overview (the AI response Google shows at the top of the SERP)
- AI Mode — Google’s conversational AI mode
- ChatGPT
- Gemini
- Perplexity
The answers come from the public versions of the assistants, as a user sees them on the site or on the Google page, not from the model APIs: details in the methodology.
Claude and Copilot are not yet tested. Coverage reflects the surfaces where the average user actually searches.
Sources don’t all answer at once. Since each source is queried in sequence (and each one over multiple runs), hours can pass between the first source saving its result and the last one. Meanwhile, sources that haven’t answered yet show ⏳, not an error — see When a cell shows ⏳ or ⚠ below.
Share of Voice: why a prompt runs multiple times
AI assistant responses are non-deterministic: the same prompt asked twice can cite different brands. A single ✓/✗ answer isn’t enough to say whether you’re truly present for that query.
That’s why Miraqo runs each prompt K times (default K = 3 runs) per source and measures the Share of Voice (SoV): the percentage of runs in which your brand was mentioned. Example: mentioned in 2 out of 3 runs → SoV 67%.
- The project’s average SoV is the mean of this value across all monitored prompts: it’s your overall “share of voice” with AI assistants.
- Similarly, link presence is no longer a yes/no but a ratio (e.g. cited in 2/3 runs), with the average citation position.
Prompts analysed with the old single-run method remain readable: where there’s no K-run sample, the table still shows the classic ✓/✗ (backwards compatibility). SoV appears as prompts are re-analysed with sampling.
Configuring prompts (Settings → AI Prompts)
Prompts are not configured from the Report page: they’re managed in Settings → AI Prompts tab of the project (see Project settings). For each prompt you choose which of the 5 sources to activate (at least one must remain on): tick the models and confirm with the Save button that appears next to the toggles.
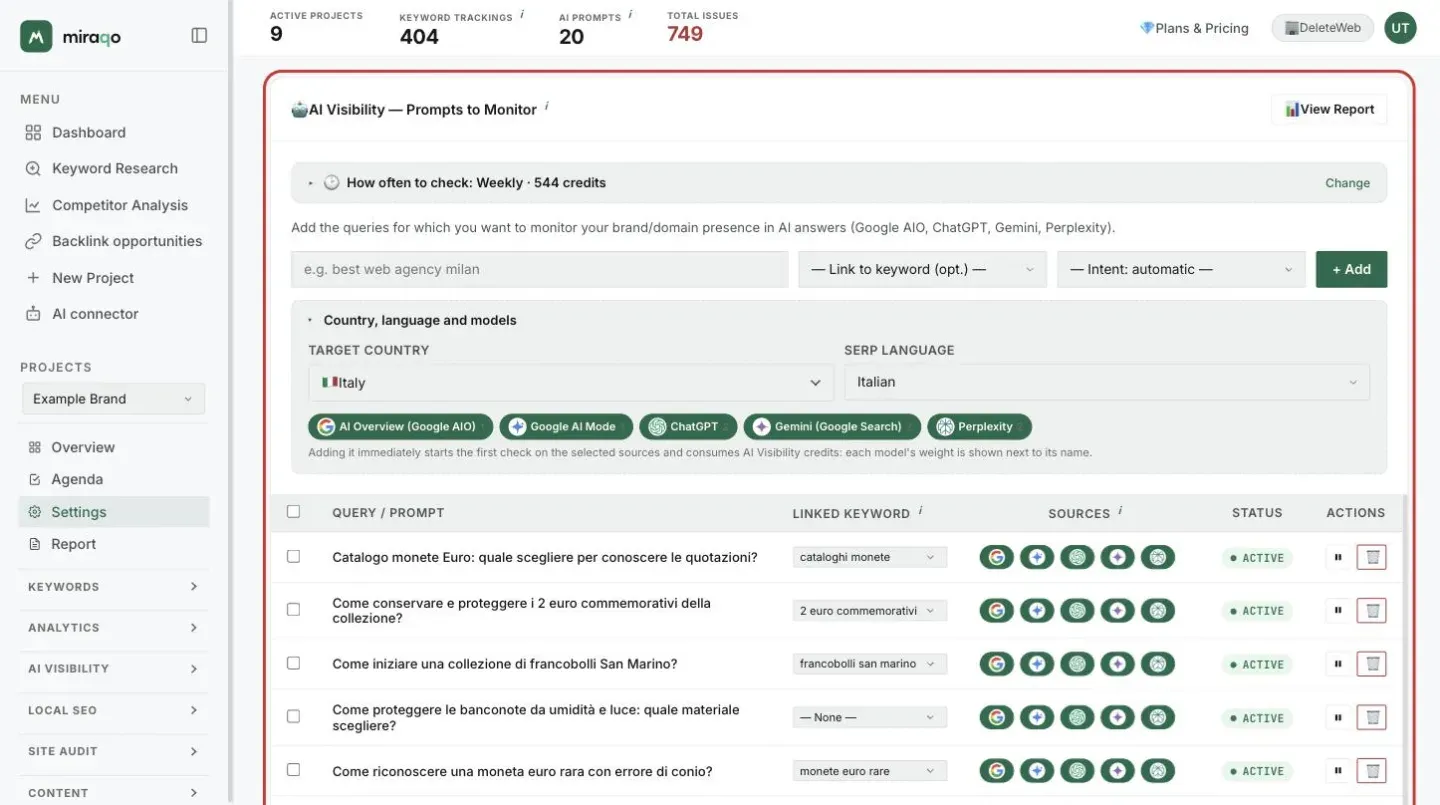
Activating a model starts a check right away, on that model only (the others already have their data). Without it, the newly added model would stay empty until the scheduler’s next window — up to 15 days on a monthly plan.
The recommended way to start is the topic-first flow: describe 3-8 topics your business covers and Miraqo generates balanced conversational prompts by intent (informational, comparative, commercial, problem-solving). Or use Prompt Research starting from a single seed topic for the full map of questions along the search journey. See the dedicated guide: Business topics — generating AI prompts.
Alternatively you can always add prompts manually from the form at the top of the Prompts to Monitor card. All the ways to find new ones are below the table instead, in the Find new prompts card, split into tabs: Business topics, Prompt Research, Prompts from a page, Recurring questions (the questions that emerged from AI answers to your prompts), From keywords (only if Search Console isn’t connected) and From CSV. The tab you open stays selected next time.
In the form, under Country, language and models, you also pick the prompt’s country (default: the project’s) and the models to activate: the models’ web search starts from there, and the same prompt can be tracked on several countries as separate rows — a flag in the table marks the ones outside the project market (countries and languages).
Specificity before volume. Generic prompts like “best management software” have too many players in play. Niche prompts (“dentist management software Italy”) are more realistic and attainable. Start with 10-20 prompts representative of the customer journey, mixing different intents: direct (“what’s the best X?”), comparative (“X vs Y, which to choose?”), how-to (“how to do X?”) where the brand can be proposed as a solution.
The Monitored Prompts page
From the project → sidebar AI Visibility → Monitored Prompts group (🤖 icon). The AI Visibility group also includes three dedicated pages: AI Overview impact (effect of AI Overview on monitored keywords), AI Competitors (who AIs cite instead of you) and GEO Audit (the brand’s identity as seen by AIs). Top right, the ⚙️ Manage Prompts button goes directly to the AI Prompts tab in Settings.
Empty state
If you haven’t configured any prompts yet, the page shows an empty state with “Go to Settings” button.
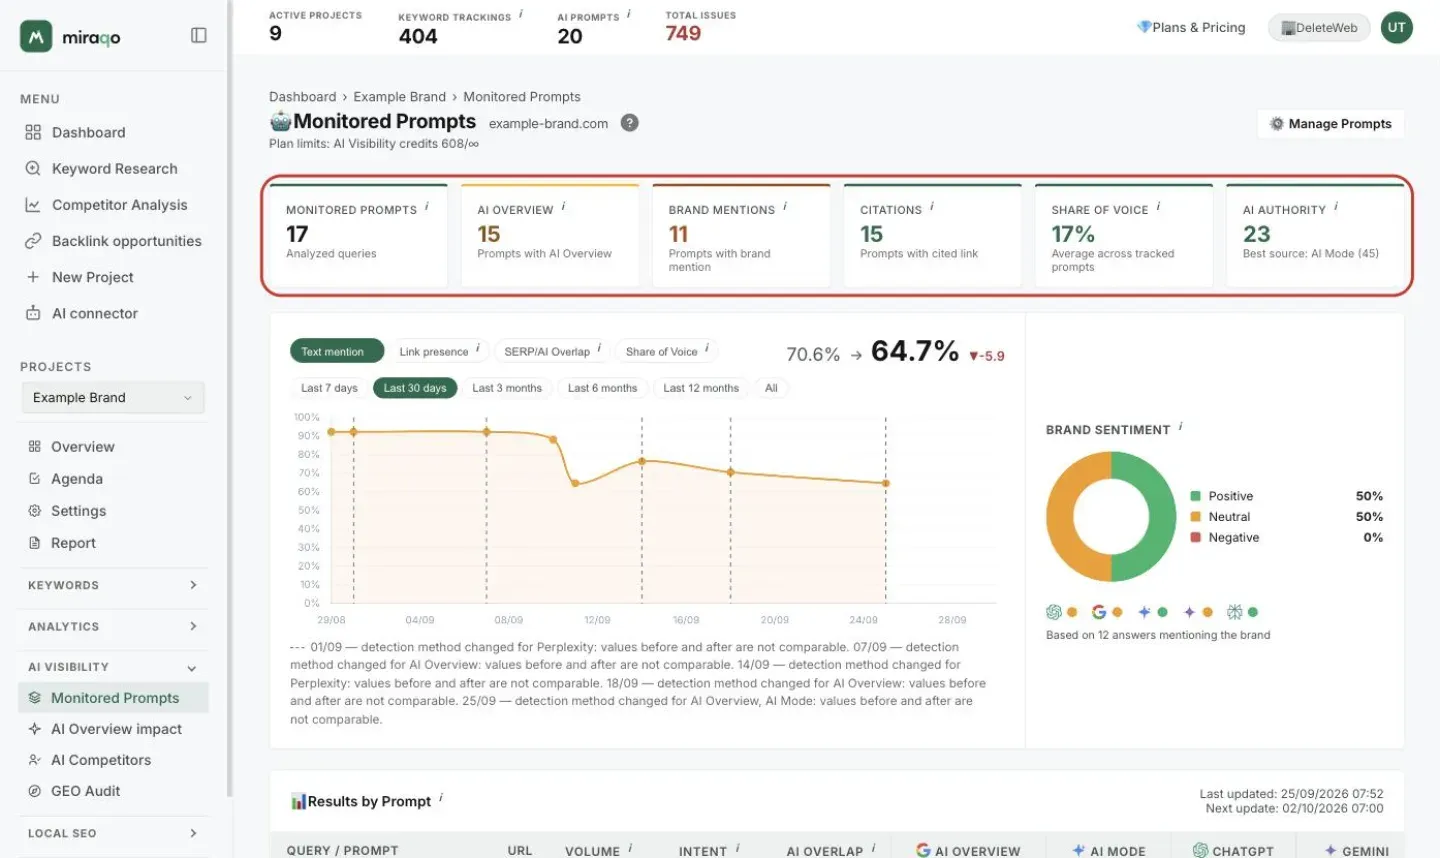
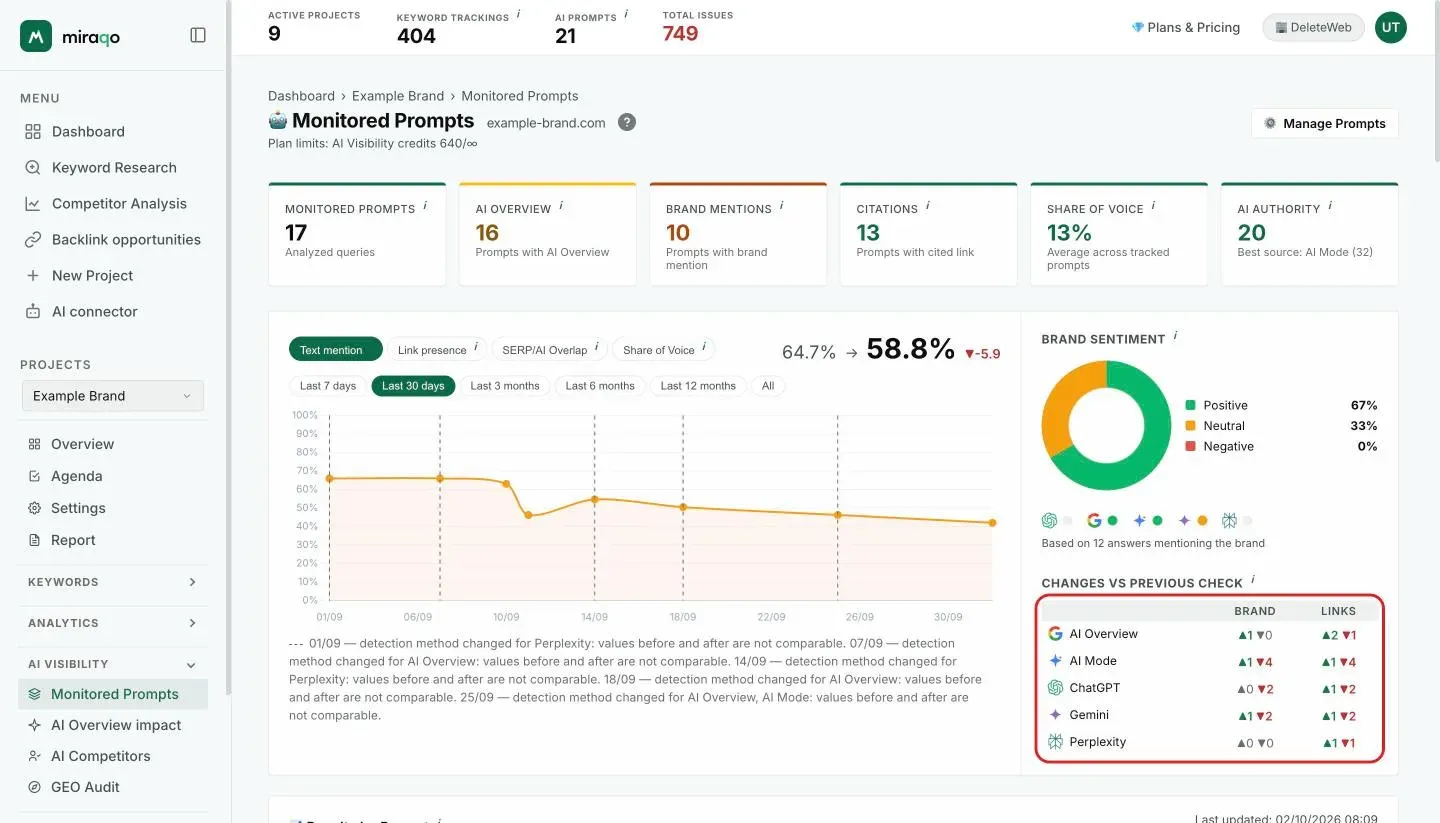
The 6 stat cards
- Monitored Prompts — total number of active queries
- AI Overview — how many times, across monitored prompts, Google AI Overview appeared (even if your brand isn’t cited)
- Brand Mentions — how many times the brand name was mentioned in the text of AI responses
- Citations — how many times a link to your site was cited as a source
- Share of Voice — the brand’s average share of voice: percentage of runs (repeated executions of the same prompt) in which the brand was mentioned, averaged across all monitored prompts. Shows
—with “Awaiting sampled runs” until no prompt has been analysed with K-run sampling - AI Authority — a 0-100 brand-authority score in AI answers: combines mentions (40%), source citations (30%), recommendations as a solution (20%) and average position among cited sources (10%), averaged across monitored sources. The subtitle shows the best-performing source. The same score appears in the AI Search card of the project overview
The trend chart
Above the table, a chart like the one in Rankings: the metric chips pick what to show, the range chips (Last 7 days, 30 days, 3/6/12 months, All — default 30 days) how far back to look, and on the right you see the “before → now” value with the delta between the last two points.
- Text mention (default) — share of the monitored prompts where the brand is named in the answer text. It counts prompts, not single sources: one source is enough for the prompt to count, so the last point matches the stat cards at the top of the page
- Link presence — share of the prompts where the site is cited as a source with a link, in at least one AI source
- SERP/AI Overlap — share of the comparable prompts where AI cites the very page that ranks organically. Prompts with no linked monitored keyword, or whose keyword doesn’t rank, stay out of the count; if no prompt is comparable the chip doesn’t appear
- Share of Voice — historical trend of the brand’s average share of voice. Appears only when there is sampled run data to build the trend
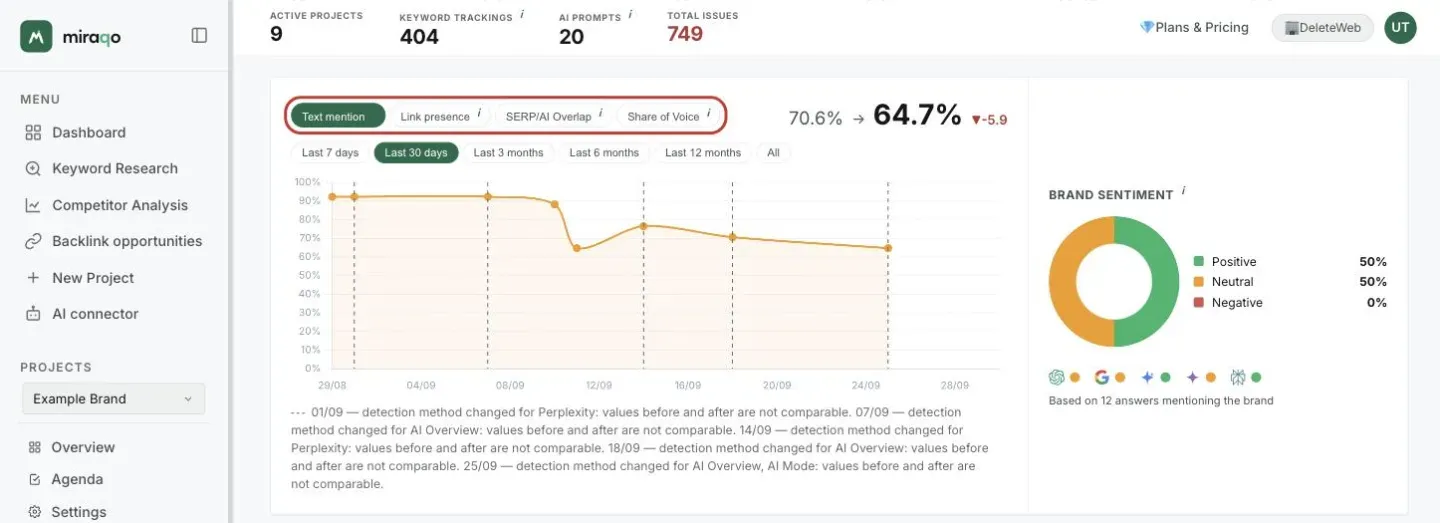
Each point is the state of the prompts on that day (the last known result of each one), not just the checks run on that date: a prompt added today doesn’t redraw the curve, and days without checks don’t break the line. The series starts from the last check before the selected range, so the line comes in from the left edge even on a monthly cadence.
On the first check the chart shows a single point; without historical data it is empty: “charts will appear after the first analysis”.
Brand sentiment
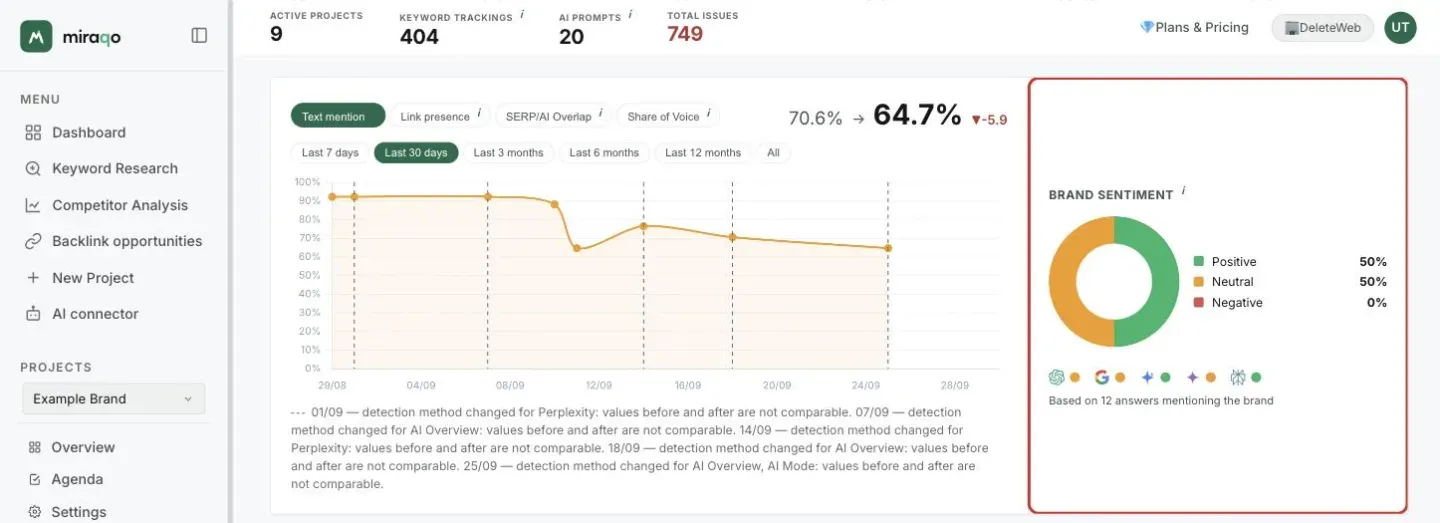
To the right of the chart, the Brand sentiment box tells you how the AIs talk about you in the responses where they name you: the donut splits the responses into Positive, Neutral and Negative, with the percentages next to it. Below, the model icons carry a coloured dot with each model’s prevailing tone (on a tie the most unfavourable wins), and the last line says how many responses it’s calculated on. Responses that don’t name the brand are not counted.
If you’ve run a GEO Audit for the project, the GEO Audit of … row appears below with each model’s tone in the audit, which asks the AIs about the brand by name. It’s a separate source and is not added to the donut: monitored prompts measure how they describe you when answering generic questions, the audit how they describe you when someone asks about you.
Changes vs previous check
Below the sentiment, the small Changes vs previous check table sums up, for each model, how many prompts gained (▲) or lost (▼) the brand mention and the link to your site compared with the previous check. It is the sum of the arrows in the table below, with the same rule: only a majority change across runs counts. Only models with at least one prompt checked twice appear; before the second check the card says there is nothing to compare yet.
The “Results by Prompt” table
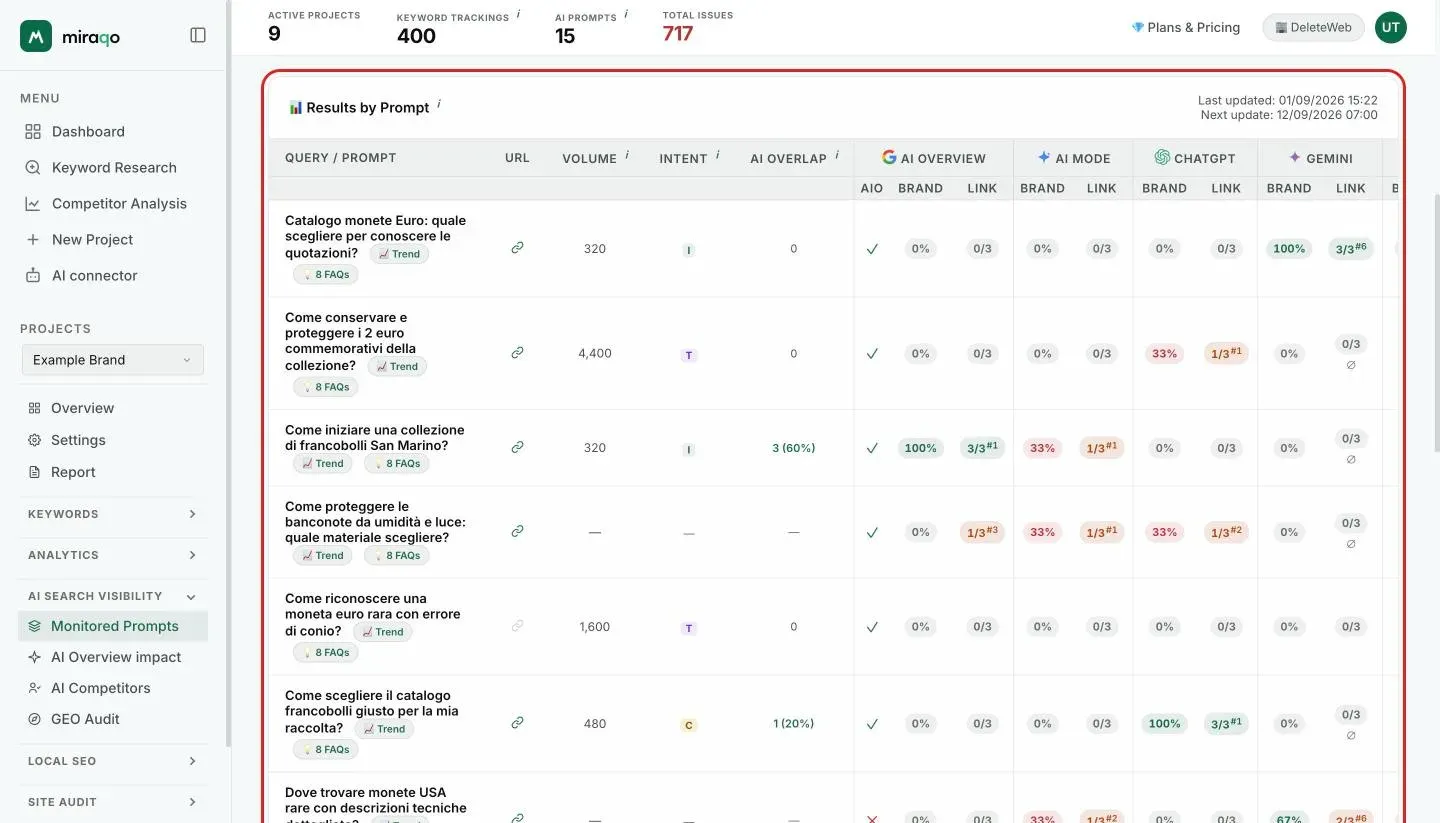
One row per prompt, with these fixed columns:
| Column | What it is |
|---|---|
| Query / Prompt | Prompt text (+ 📈 Trend button with the per-source history and 💡 FAQ button if there are suggested FAQs — see below) |
| URL | Link icon to your site page ranking in SERP for the query (— if not ranking) |
| Volume | Monthly Google searches in the project’s country |
| Intent | Coloured badge: I Informational, N Navigational, C Commercial, T Transactional |
| AI Overlap | In how many AI sources the page that ranks organically for the query also appears among the cited ones, with the % over the sources that answered. — when no monitored keyword is linked to the prompt, or the keyword doesn’t rank: without a reference page the overlap can’t be computed, and it is not a zero |
For each AI source (AI Overview / AI Mode / ChatGPT / Gemini / Perplexity) the row has Brand and Link sub-columns (for AI Overview there’s an additional AIO column):
- AIO — ✓ if the AI generated a response for the query (the AI Overview/response was “triggered”); ✗ if not
- Brand — the Share of Voice: a pill with the % of runs in which the brand is mentioned, coloured by band (dark green = high ≥67%, amber = medium 34-66%, red = low 1-33%, grey = 0%). The tooltip shows the detail “Mentioned in m/K runs”. For prompts not yet sampled, shows the classic ✓/✗
- Link — the citation ratio: in how many runs (out of K) a link to your site appears among the sources (e.g.
2/3). The small superscript#Nindicates the average citation position (e.g.#3= third source). For unsampled prompts, shows the classic ✓/✗
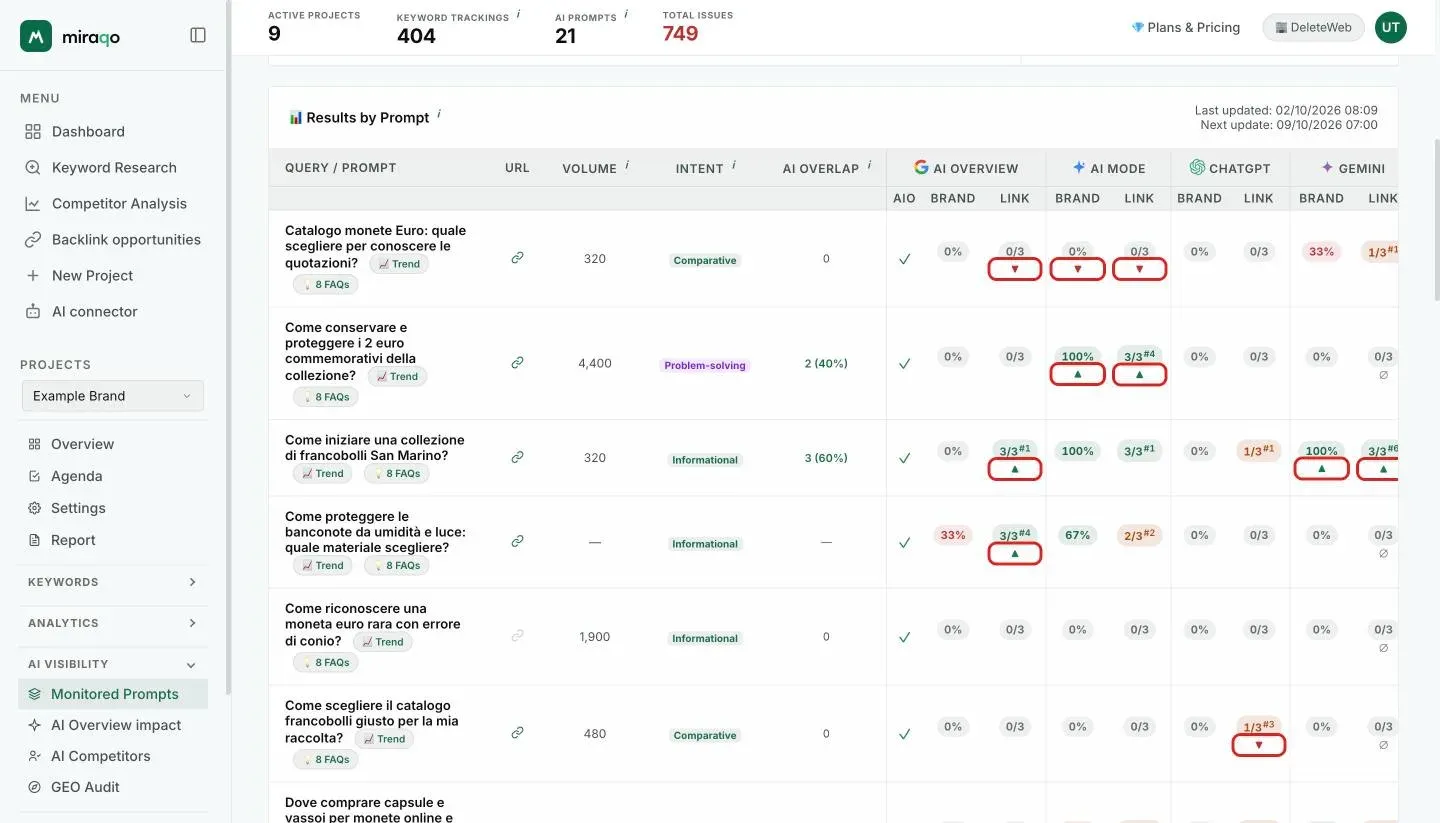
▲ ▼ arrows below the pills — they compare the result with the previous check of the same source: green ▲ if the brand (or the link) appeared, red ▼ if it disappeared. They only show up for a majority change across runs (e.g. from 3/3 to 0/3): one run more or less is sampling noise and is not flagged. There are no arrows on the first check. The tooltip shows the date of the previous check. These are the same changes you receive in the summary email at the end of the check.
Every cell is clickable, even when it shows ✗. Clicking any cell (AIO, Brand or Link) of an analysed prompt opens the detail panel with the full response, cited brands and all sources — especially useful for negative results, to see who was cited instead of you.
At the bottom of the table, a legend explaining AIO / Brand / Link and the ⏳ / ⚠ markers.
When a cell shows ⏳ or ⚠
Two markers can appear next to a source’s result (or in its place). They don’t mean the same thing:
| Marker | Meaning | What to do |
|---|---|---|
| ⏳ | Check in progress: that source hasn’t answered yet. Sources run one after the other, so it’s normal to see it on the last ones in the row while the first already have fresh data. If the cell still shows a value, it’s from the previous check (the tooltip gives the date) | Nothing: wait for the check to finish |
| ⚠ | Last check failed: the AI source was unavailable and the data is stuck at the date shown in the tooltip | If it persists across several checks, open a support report |
| ∅ | Answered from memory: in every run of the check the model did not consult the web (no source cited, by anyone). The 0/3 under Link does not mean “it doesn’t cite you”: it didn’t look. It happens mostly with Gemini, which decides on its own whether to search; it is not an error, and the next check may search. |
An error on one source doesn’t stop the others: the remaining sources are queried anyway and save their own result.
Per-source trend (📈)
Next to each prompt in the table there’s a 📈 Trend button: open it to expand a chart below the row with the history of that single prompt, source by source.
- Two selectable metrics: Mentions and Citations, both as percentages — so sources sampled over K runs (Share of Voice) and single-run ones sit on the same axis
- One line per AI source, with colours consistent across prompts; click a source in the legend to hide it from the chart
- Days when a source wasn’t checked don’t break the line: the chart spans the gap
- If the prompt has no history yet: “No history yet for this prompt”
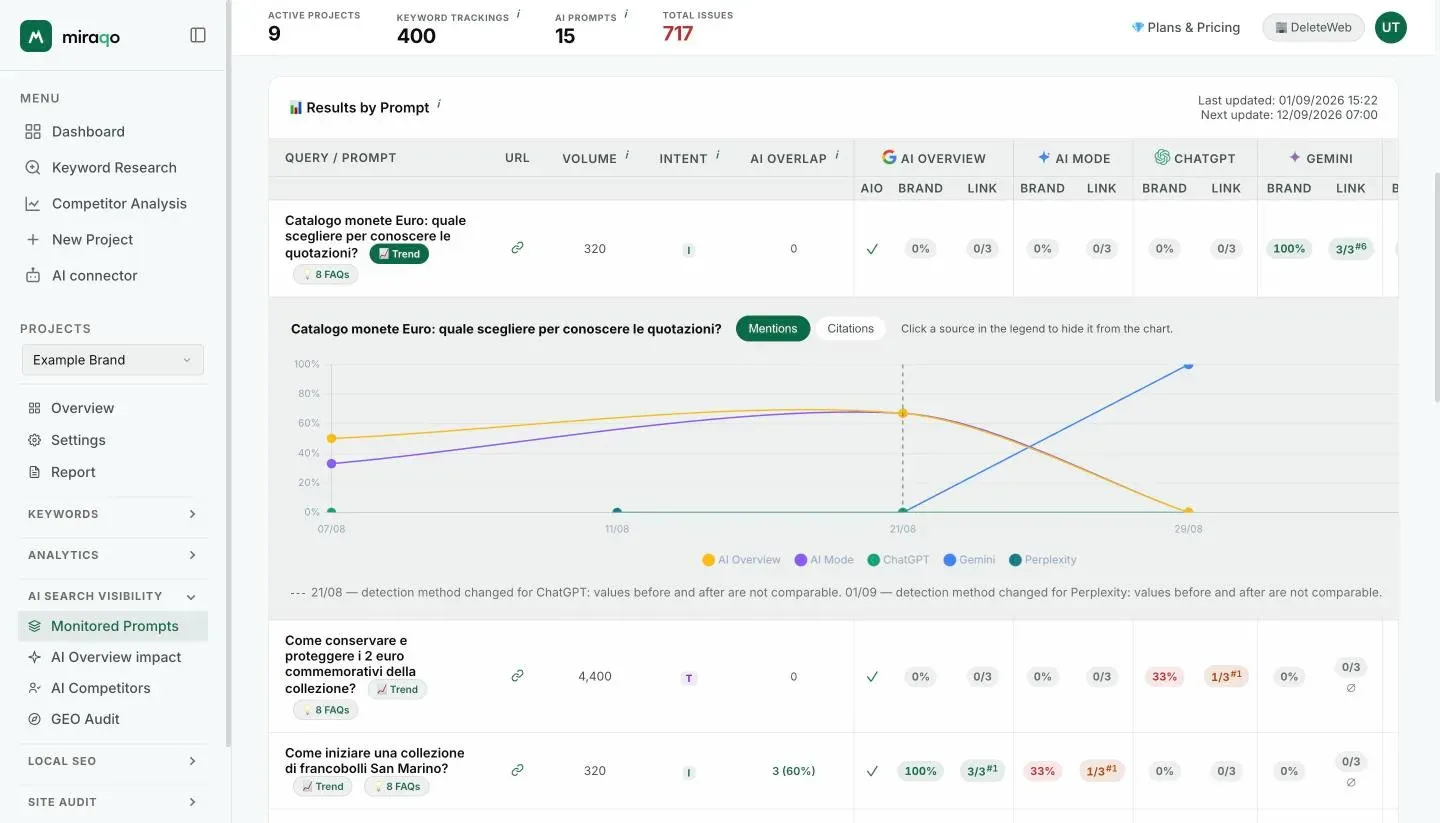
It answers the question the table alone can’t: am I improving on ChatGPT but declining on Perplexity, or is this a general movement? The data is already collected: opening the trend consumes no credits.
Suggested FAQs (GEO)
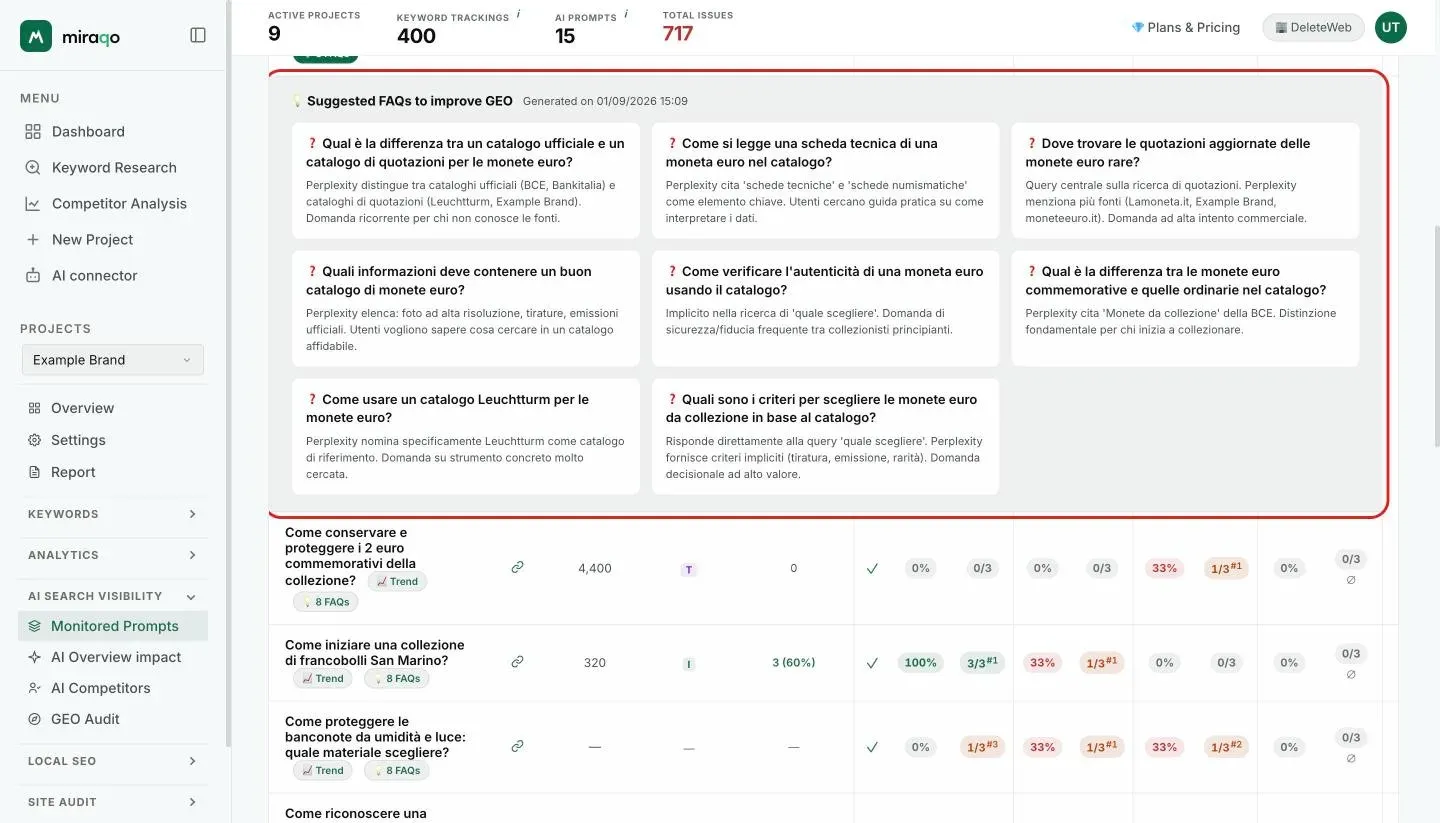
For prompts where Miraqo has generated suggestions, next to the query text you’ll find the 💡 N FAQs button: click it to expand a row below with suggested FAQs to improve GEO (Generative Engine Optimization). Each FAQ is a concrete question that, added to your site (in an FAQ page, an article or a dedicated section), increases the probability that the AI cites you for that query — with a “why” note explaining the rationale.
“Why not?” — the page that should answer
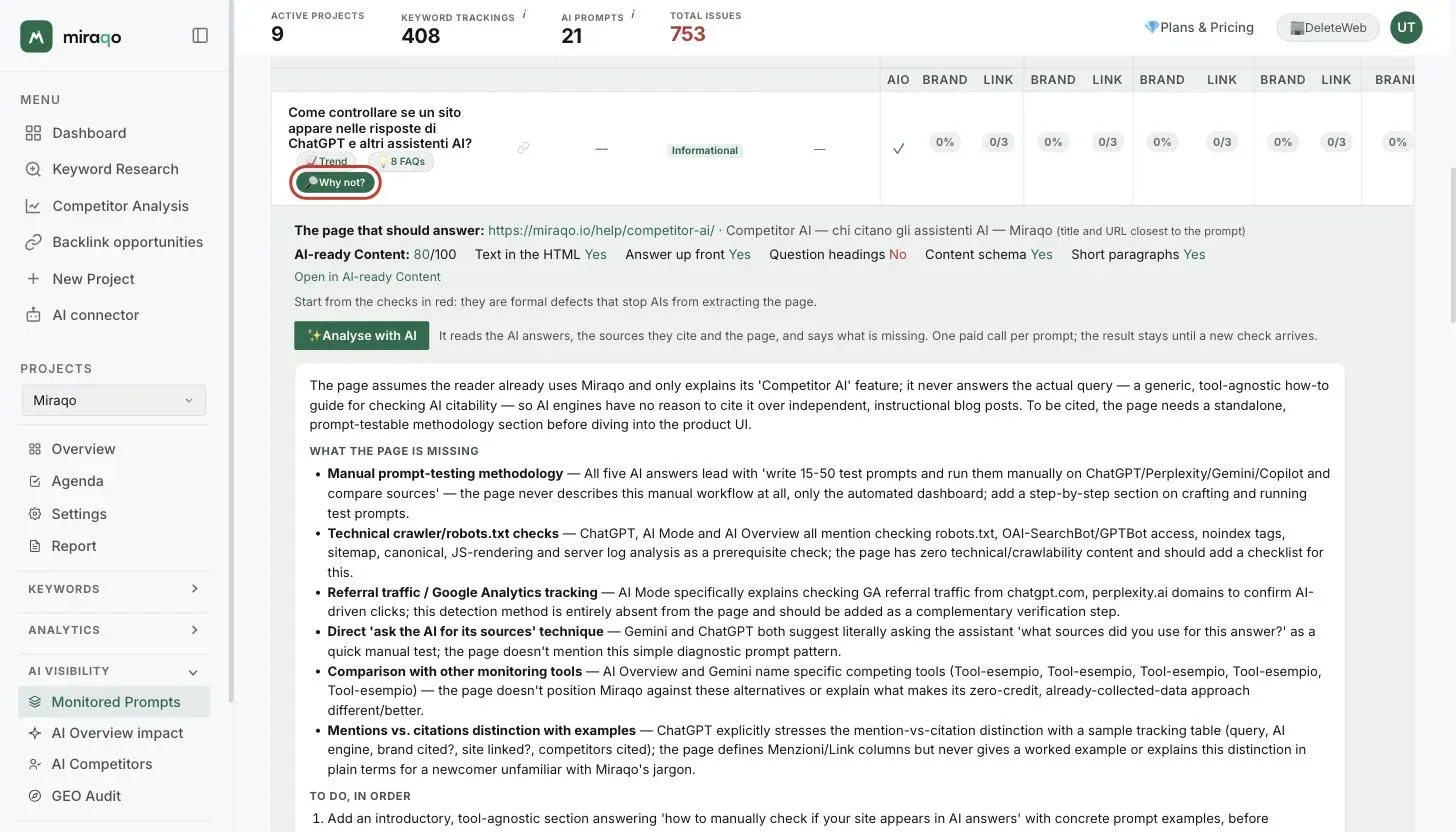
Next to every prompt that no AI source cites you find the 🔎 Why not? button. Opened, it shows the page of the site that should answer (the URL ranking on Google for the linked keyword, otherwise the one whose title and URL are closest to the prompt), its AI-ready Content score with the five checks of form, and a one-line verdict. If no page resembles the prompt it says so: there is no content for that intent. From there, ✨ Analyse with AI compares the AI answers and the sources they cite with the page and says what it is missing (a paid call, within the plan’s monthly budget; the result stays saved until the next check). All the details in the AI-ready Content guide.
Response detail panel
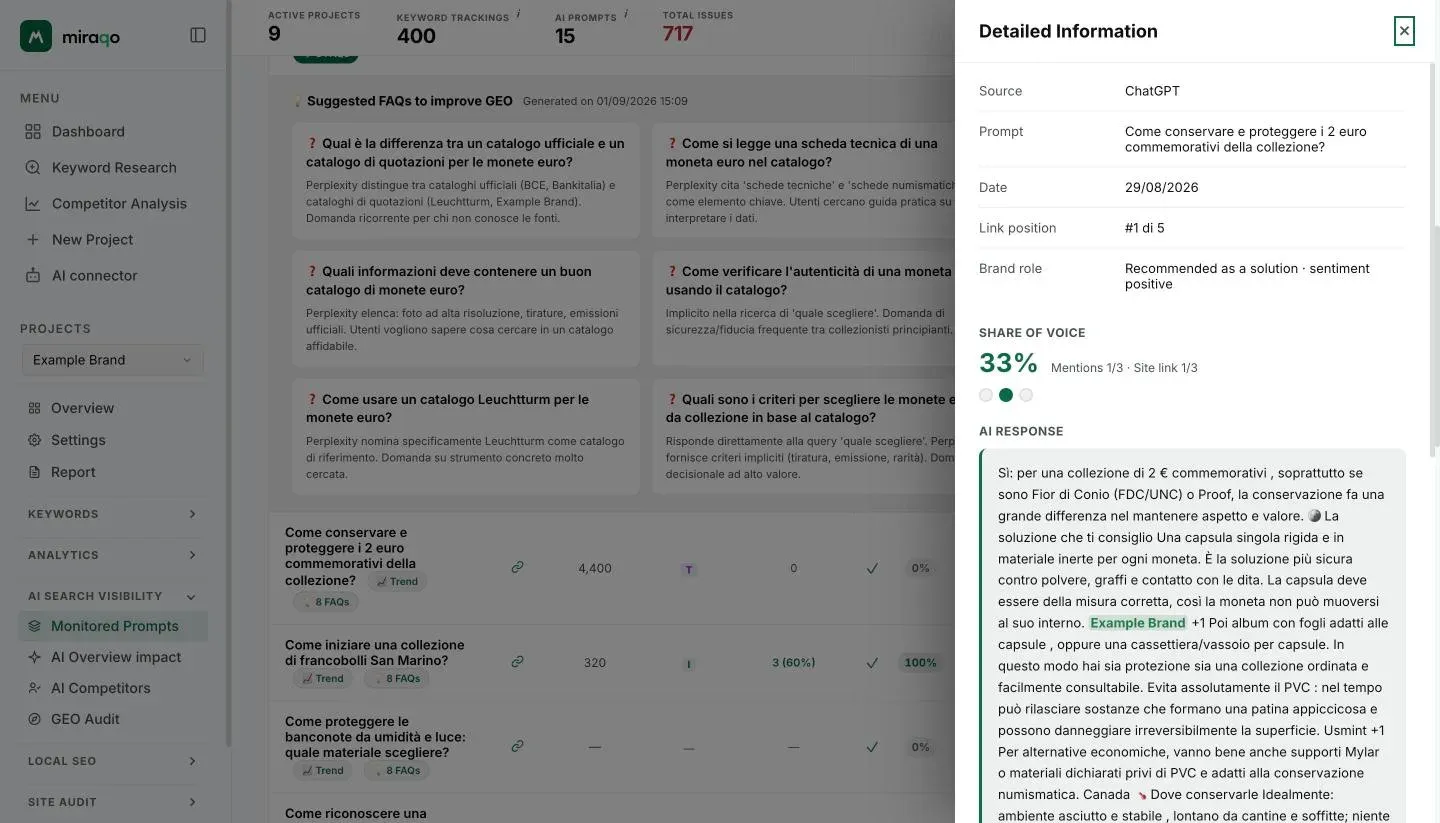
Clicking any cell (AIO, Brand or Link — both ✓ and ✗) of an analysed prompt opens a side panel that slides from the right with:
- Share of Voice (only for prompts sampled over K runs) — the SoV value in large, the breakdown “Mentions m/K · Citations c/K” and a row of per-run dots: one dot per execution, coloured by outcome (cited / mentioned / absent) with tooltip showing the citation position in that run. Lets you see at a glance how stable your presence is from one run to another
- The full AI response text (no longer truncated), rendered in markdown, with clickable
[n]citations - Brands named in the text — the list of all brands/companies mentioned in the response, with your brand highlighted in green: tells you immediately who you compete against on that prompt
- Linked sources — the complete list of sources, shown as chips with favicon + domain and their position (your domain is highlighted)
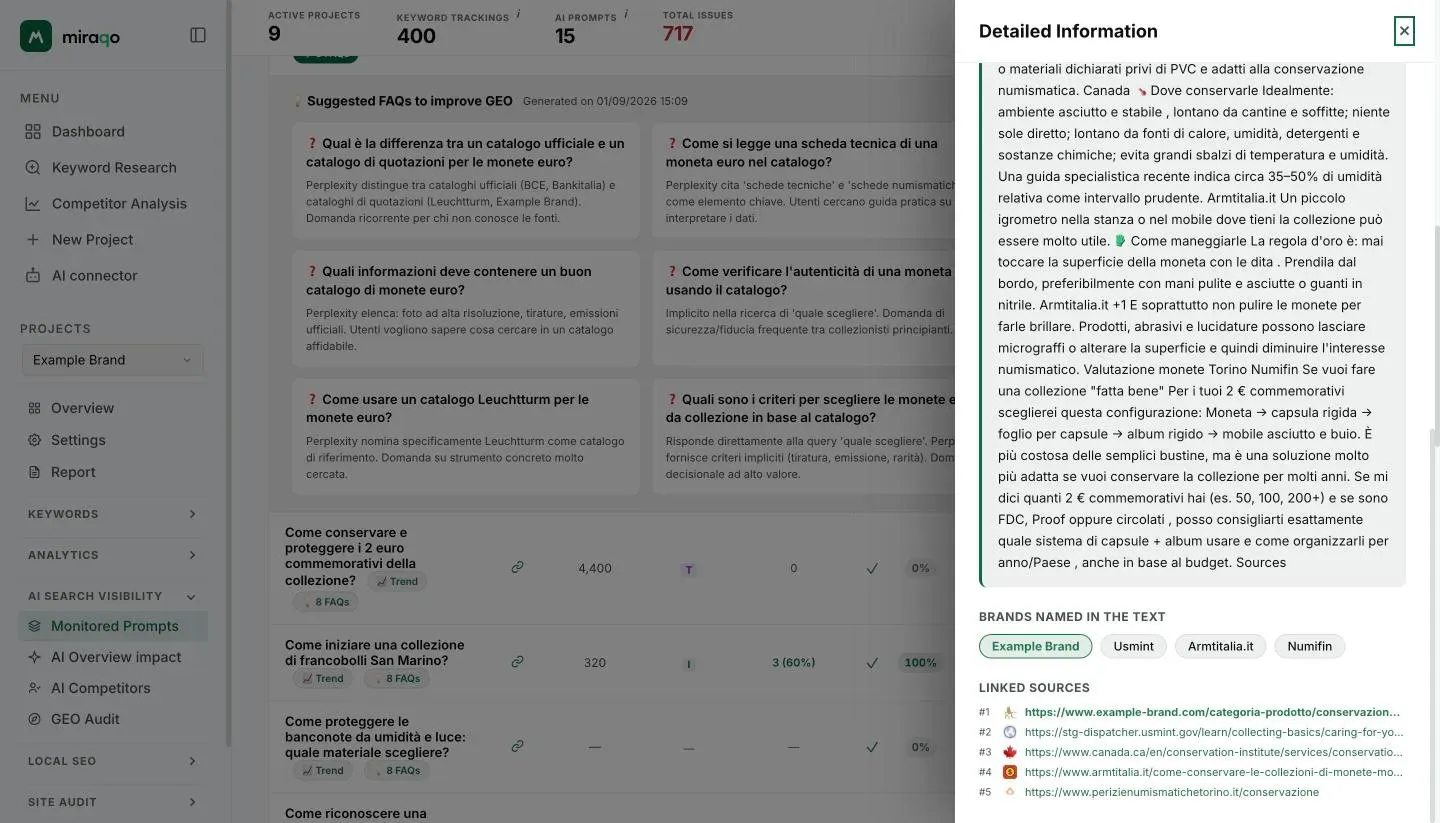
The data shown is what was already collected during the prompt analysis: opening the panel doesn’t consume credits or launch new AI requests.
Negative results. Even when you’re neither mentioned nor cited, the panel is still useful: you see the response text, which brands were mentioned and which sources the AI chose instead of you — the basis for understanding what gap to fill.
No AI response. If no AI Overview was generated for that prompt (typical of Google AI Overview / AI Mode on queries not yet “AI-eligible”), the panel shows “No AI Overview generated for this prompt”.
Useful for understanding how you’re presented (neutral recommendation, alternative, part of a list) and who precedes you.
Visits from AI assistants
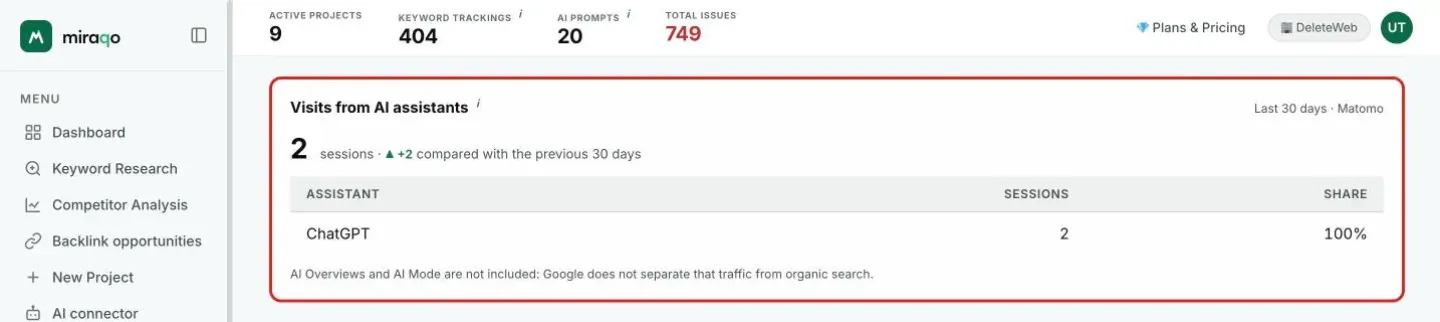
With Google Analytics 4 or Matomo connected to the project, the Visits from AI assistants card counts the sessions that reached the site from ChatGPT, Perplexity, Gemini, Copilot, Claude and similar in the last 30 days, compared with the previous 30 days, with each assistant’s share. It is the other half of the measure: the prompts tell you whether AIs cite you, this card tells you whether anyone then clicks. AI Overviews and AI Mode are not included, because Google does not separate that traffic from organic search. On first connection the 90-day history arrives with the next nightly update.
AI crawlers on the site (Cloudflare)
If your site is behind Cloudflare, the AI crawlers on the site card (below the visits from AI assistants) shows which ChatGPT, Perplexity, Claude and Gemini crawlers fetched which pages in the last 30 days and how many requests were rejected at the edge (WAF, rules, challenges). It also works on Cloudflare’s Free plan.
How to connect it. In Project settings → Cloudflare you need an API token and the zone ID. Create the token in Cloudflare under My Profile → API Tokens → Create Token → “Create Custom Token”, with the single permission Zone → Analytics → Read limited to the site’s zone. The zone ID is on the domain’s Overview page, right column. The “Test connection” button checks both before saving.
What it shows. For each crawler: what it feeds (ChatGPT, Perplexity, Claude or Gemini), pages read, requests and rejected requests. Then two cross-checks no Cloudflare panel does: crawlers disallowed by your robots.txt that still get through (from the latest audit), and site pages cited by AI that no crawler read in the period. At the bottom, the most read pages.
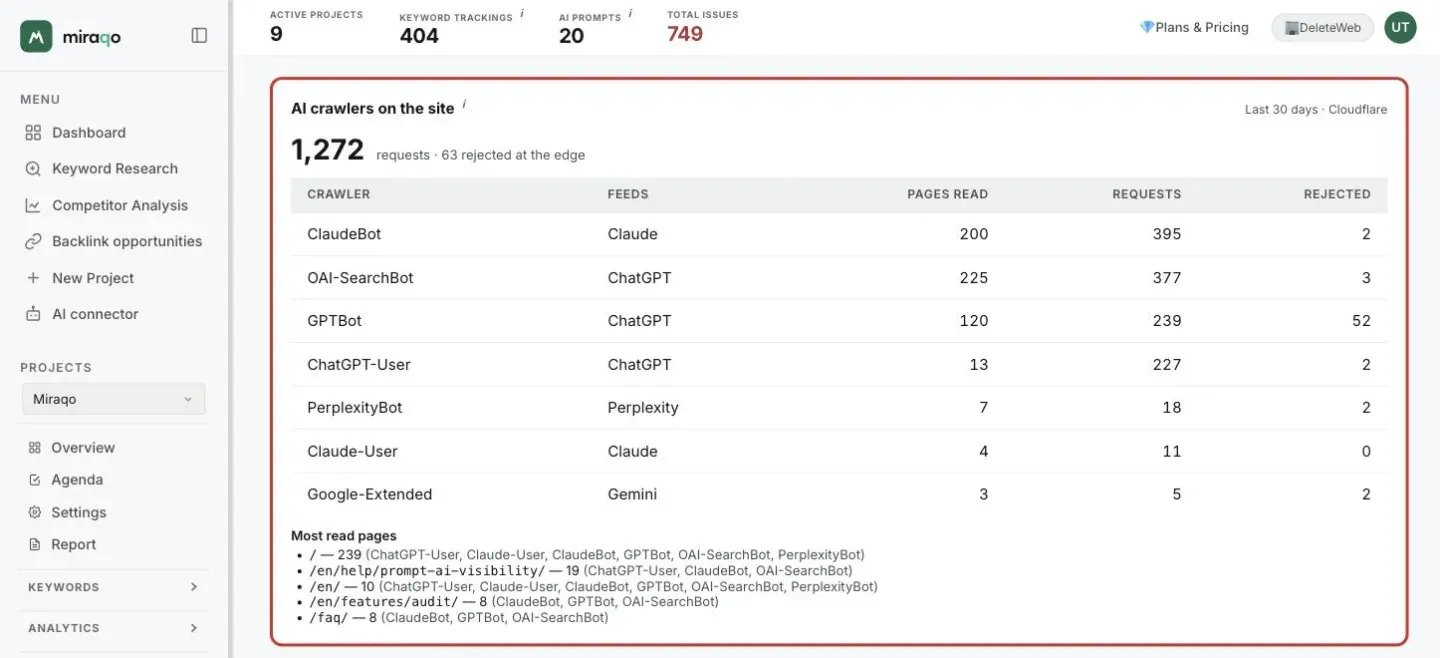
Limits. Counts are Cloudflare estimates (adaptive sampling), so on a large site they may differ slightly from the dashboard. The user agent is not verified: whoever spoofs it shows up as a bot, which is also why part of the “GPTBot” requests end up rejected by anti-bot rules. On connection you see the last 7 days; the full 30 arrive with the first nightly update. A request rejected at the edge is not a robots.txt block: Cloudflare decides the former, the audit reads the latter.
Credits and models
Your plan’s AI Visibility limit is expressed in credits: each monitored model consumes credits in proportion to its cost — Google AIO and AI Mode 1, Perplexity 2, Gemini 2, ChatGPT 2. A prompt monitored on all 5 models therefore costs 8 credits, while one on the 3 cheaper models (AIO + AI Mode + Perplexity) costs 4 credits. The plan budgets (120/280/680/1680 credits) equate to approximately 15, 35, 42 and 52 complete prompts at the plan’s default frequency — up to 120, 280, 340 and 420 prompts if you monitor a single 1-credit model (the “up to” shown on the pricing cards). Choose for each prompt which models to activate based on the plan budget.
Check frequency
You choose the frequency, project by project, in Project settings → AI Prompts: the How often to check row at the top of the card shows the current frequency and its cost, and Change opens the choice. The options are monthly, every 2 weeks, weekly or every 3 days. It is not a plan-locked feature — you pay for it in credits, because a more frequent check is the same check repeated:
| Frequency | Credit cost |
|---|---|
| Monthly | ×1 |
| Every 2 weeks | ×2 |
| Weekly | ×4 |
| Every 3 days | ×9 |
A prompt on all 5 models therefore costs 8 credits if checked once a month, 32 if checked every week. The plan only sets the default frequency: monthly on Solo and Starter, every 2 weeks on Pro, weekly on Agency. If your credits do not cover the frequency you pick, the app tells you before saving.
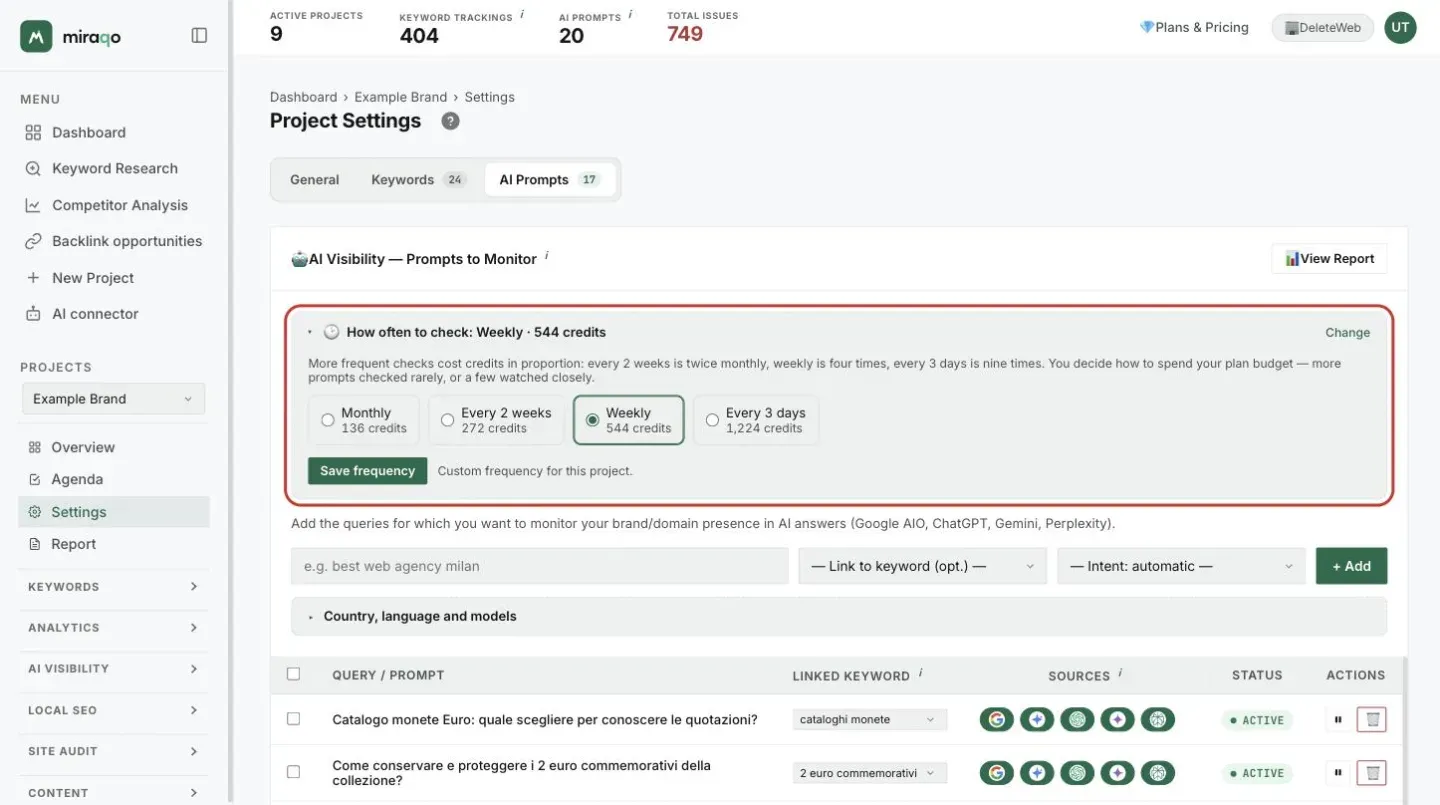
So you decide how to spend the budget: many prompts checked rarely, or a few watched closely. The first check of a new prompt starts immediately — as does activating a new model on an already monitored prompt — then the prompt joins the project round: the frequency belongs to the project, not to the single row, so when it fires all active prompts are updated together and adding one doesn’t push the others’ date forward. In the top right of the table you’ll find “Last updated” and “Next update”.
What to do with the results
- Prompts where you’re Brand ✓ but Link ✗ — the AI names you but doesn’t link to your page: often means your page on that topic doesn’t exist or isn’t structured in an “AI-friendly” way. Create or optimise the page.
- Prompts where you’re Link ✓ but Brand ✗ — the AI cites your site as a source without naming the brand: usually the problem is who “you” are on the page (missing a clear brand name at the top, Organization schema, author with E-E-A-T).
- Prompts with AIO ✗ everywhere — Google isn’t yet generating the AI Overview for that query: it’s not your fault, it’s happening because the query isn’t yet considered “AI-eligible”. Keep monitoring.
- Low AI Overlap but high SERP positions — you’re in the organic top 10 but the AI doesn’t choose you as a source: indicates the page isn’t structured to be “extracted” (missing schema, clear headers, concise paragraphs).
- Intermediate Share of Voice (amber pill) — you’re cited in some runs but not all: your presence on that prompt is unstable. It’s often the most “workable” signal — strengthen the content on that topic to consolidate the mention and push SoV toward green.
- Share of Voice declining in the trend — a competitor is gaining share at your expense: cross with the cited brands in the detail panel to understand who.
- Use suggested FAQs as an editorial plan for micro-content: each one is a concrete GEO move.
Plan limits
The AI Visibility budget for each plan is expressed in credits (see Credits and models above). In practice it equates to:
| Plan | Credits | Max prompts (1 assistant) | ≈ complete prompts/month | ≈ cheap prompts/month |
|---|---|---|---|---|
| Solo | 120 | up to 120 | ~15 | ~30 |
| Starter | 280 | up to 280 | ~35 | ~70 |
| Pro | 680 | up to 340 | ~42 | ~85 |
| Agency | 1,680 | up to 420 | ~52 | ~105 |
Complete prompt = monitored on all 5 models (8 credits); cheap = on the 3 low-cost models, AIO + AI Mode + Perplexity (4 credits). Checking multiple sources is costly: choose for each prompt which models to activate based on the plan budget.
To try it: the 14-day free trial, no credit card required, includes AI Visibility with a reduced credit budget, enough to monitor a few prompts on all 5 sources.
See also:
- AI Overview impact — the effect of AI Overview on the keywords you monitor
- AI Competitors — who AI assistants cite instead of you
- Brand GEO Audit — the brand’s identity as seen by AIs
- Project settings → AI Prompts tab to add/disable prompts and change sources
- Connect Google Search Console → to receive prompt suggestions based on real incoming queries
- How we measure AI Visibility — the public methodology: which model answers, why three runs, when a result expires and what we do not estimate
Last updated: 30 September 2026