Google positions and keyword detail
The project's Positions page (device selector, mini-cards, charts, distribution, filterable table), single keyword detail with desktop/mobile history, and management/deactivation from Settings.
The main page for reading your keywords’ rankings is Rankings (project sidebar → Keywords group → Rankings). Miraqo tracks desktop and mobile separately, because rankings often diverge. For each keyword it keeps quite a lot: the history, the ranking URL, the search intent, volume, difficulty, CPC and — if you’ve connected an analytics provider — sessions and conversion rate of the landing page.
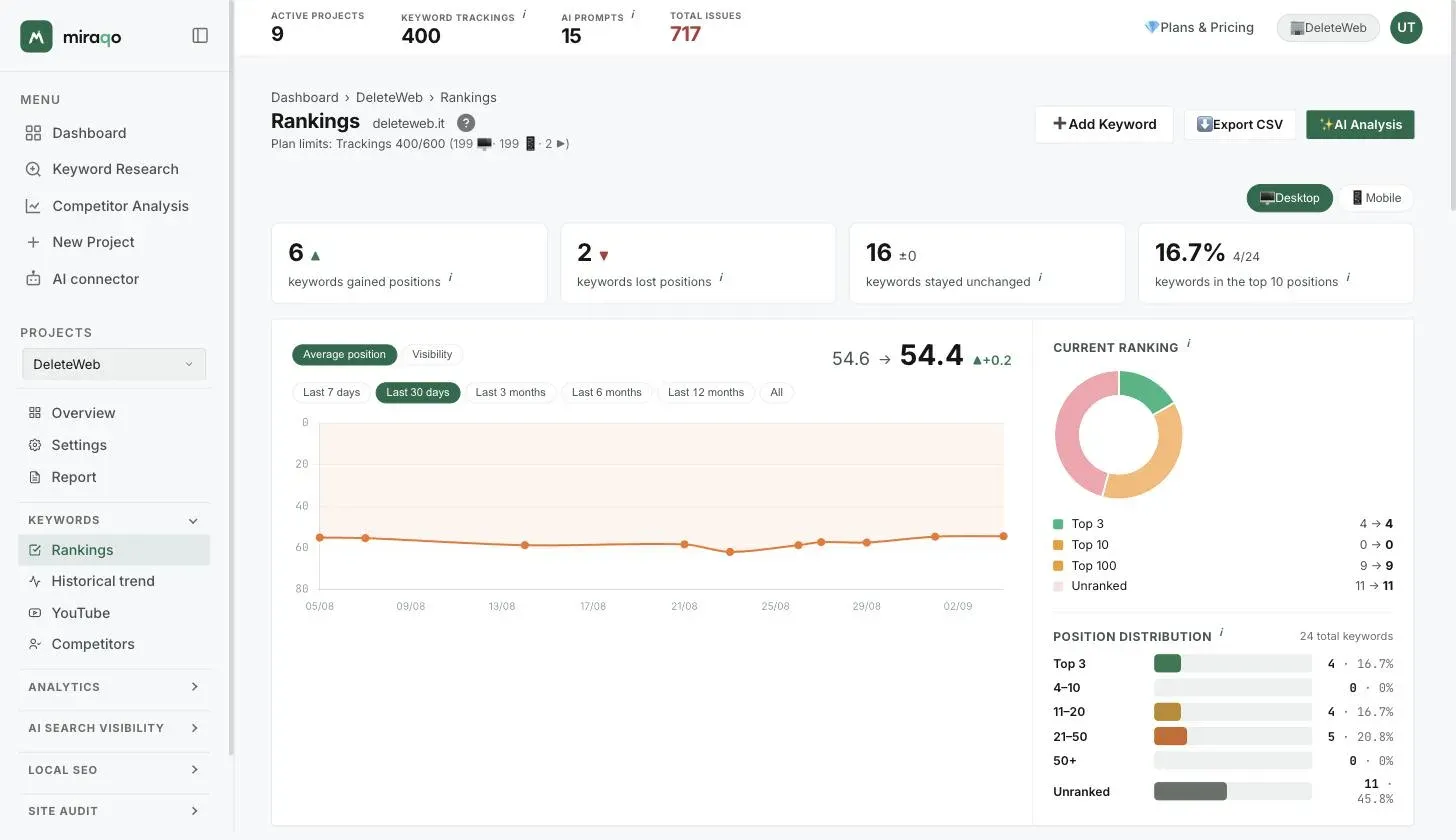
To add new keywords see Project keywords; the aggregate historical view of the project lives in Ranking History instead.
Header and global actions
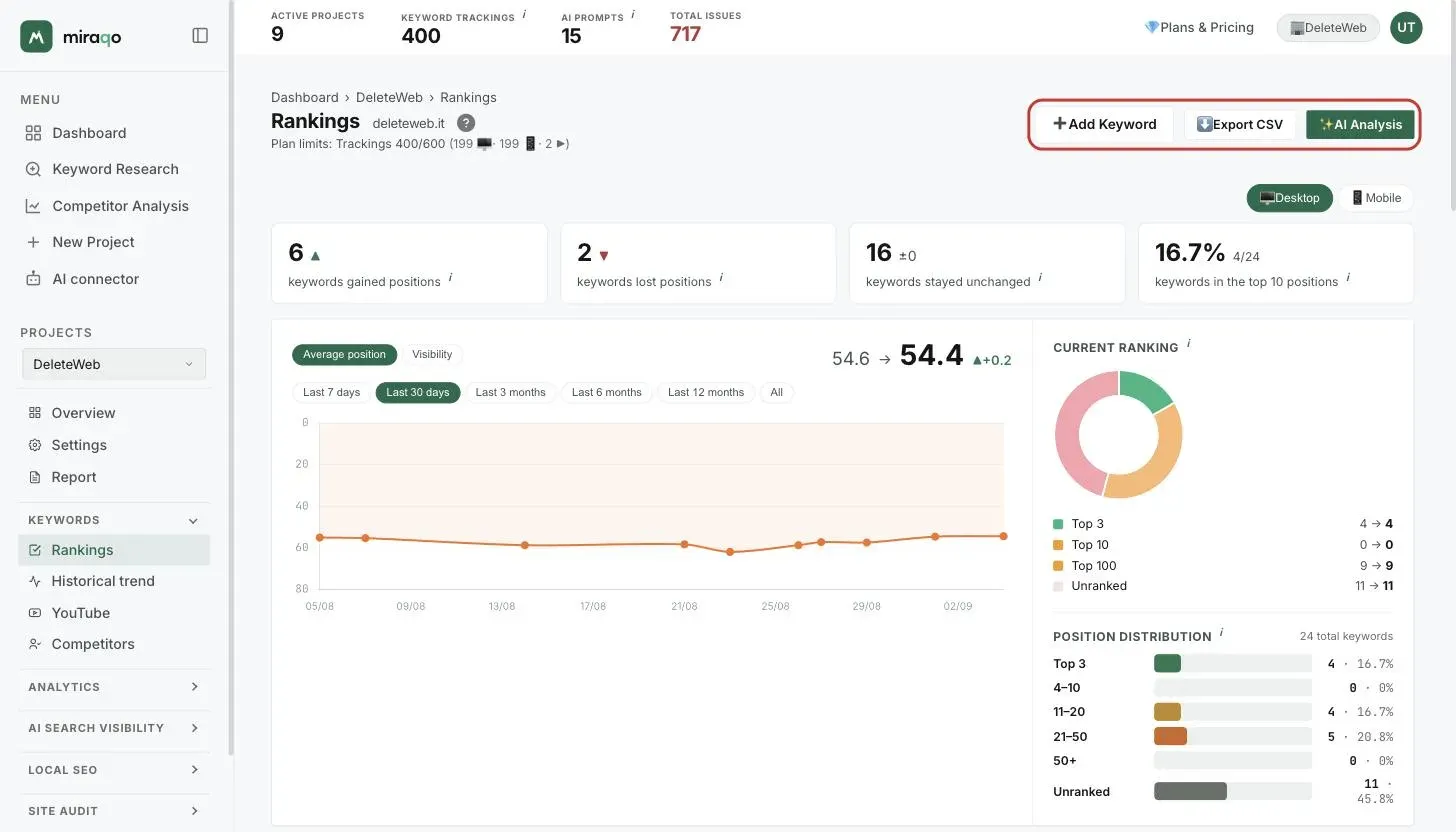
At the top, next to the Rankings title, you’ll find three actions: ➕ Add Keyword takes you to the form in Settings; ⬇️ Export CSV downloads all project keywords with positions, URLs, volume and difficulty; ✨ AI Analysis generates an analysis of the project’s ranking trend (for enabled roles).
Tasks being processed? If there are new keywords or re-checks in queue, an ⏳ banner appears with the counter.
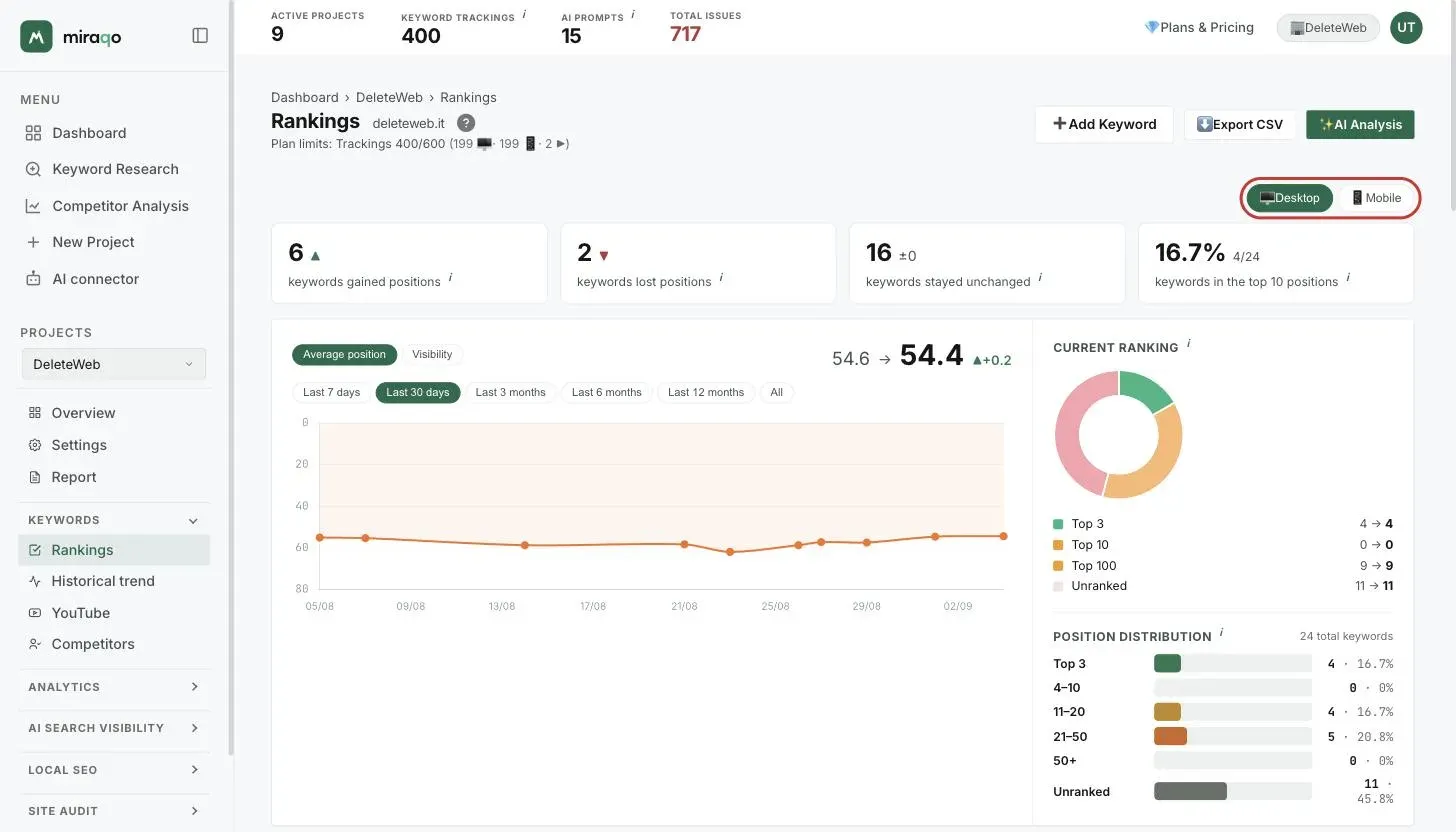
Device selector 🖥 Desktop / 📱 Mobile
It sits top right, before the stats. It changes the entire page: mini-cards, chart, ranking, distribution, and also the Previous/Current columns in the table. The preference lasts for the session.
The 4 mini-cards
Four summary counters for the active device: how many keywords gained positions since the previous detection (▲), how many lost them (▼), how many stayed unchanged (±0). The fourth is the Top 10 share: N% (X / Y) of the total monitored.
Big card: Trend + Ranking + Distribution
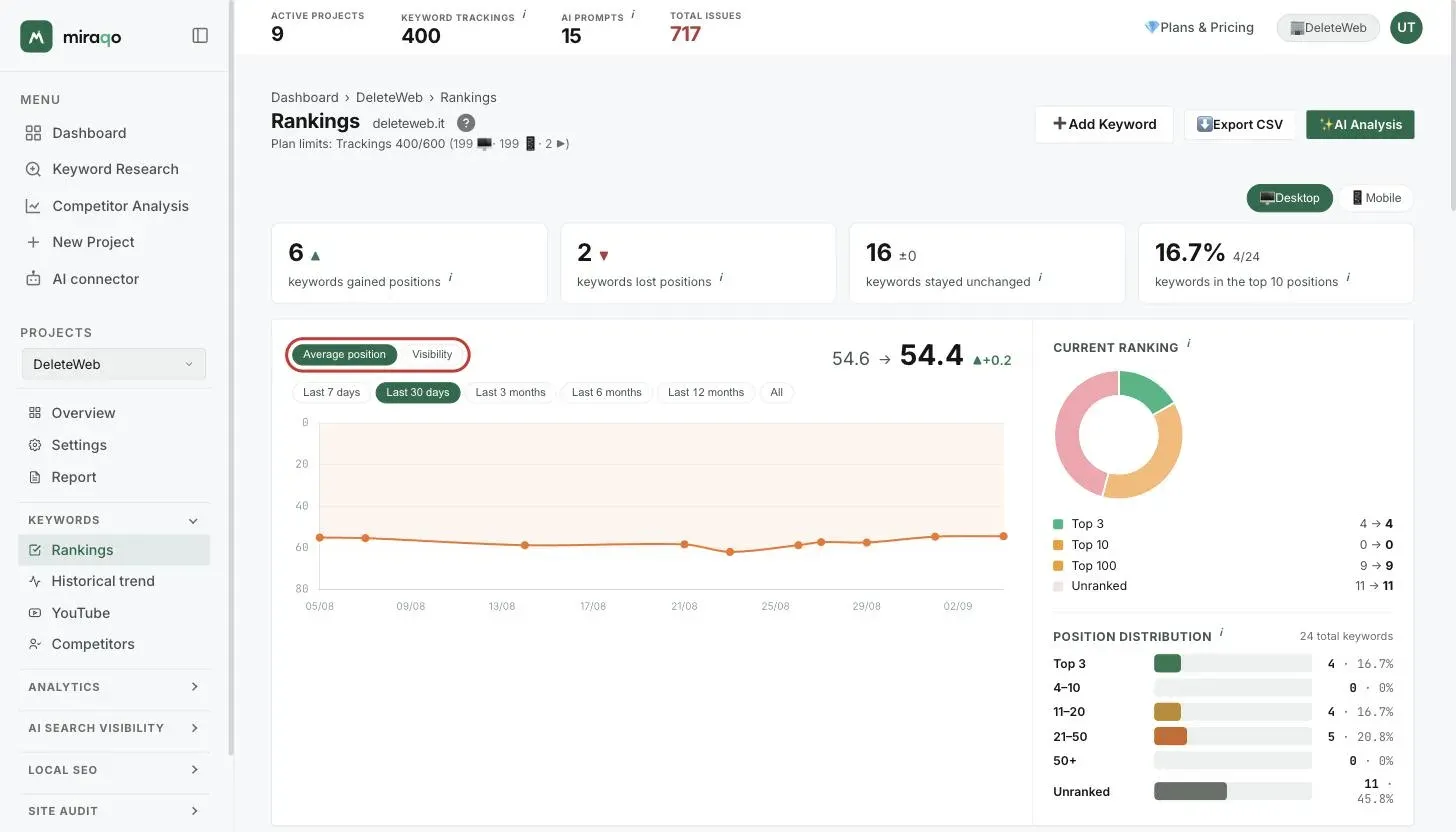
On the left is the chart, with the Average position / Visibility toggle and the time range selector (7 days, 30 days, …). For position the Y axis is inverted — #1 sits at the top, so a rising line = improvement. Above the chart: previous average position → current, with delta.
On the right, two views. Current Ranking is a pie chart with 4 bands — Top 3 (green), Top 10 (yellow), Top 100 (orange), Unranked (grey) — with previous → current value for each band; Position distribution is a histogram by band (1–3, 4–10, 11–20, …) with count and percentage.
Table filters
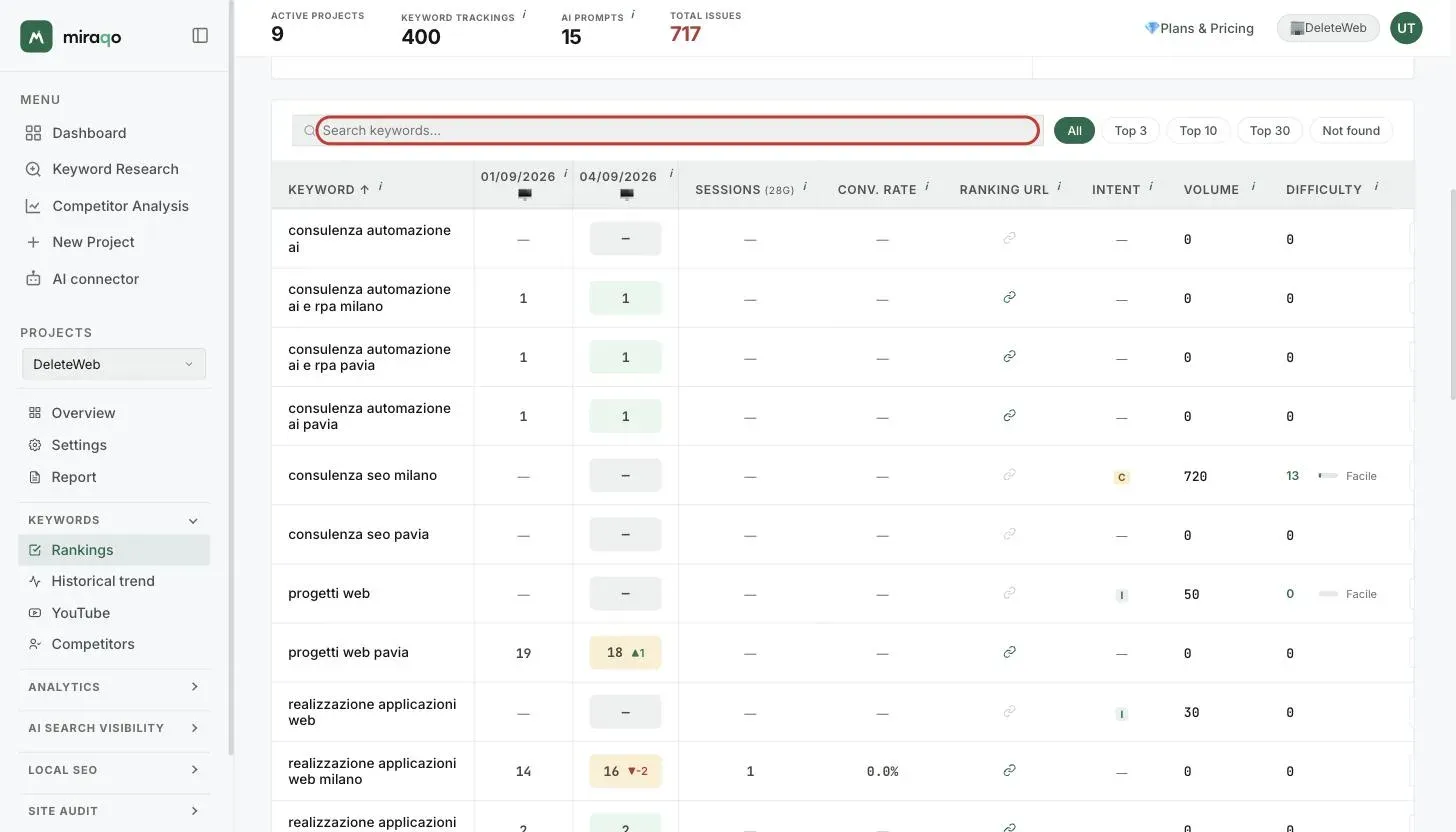
Above the table: free keyword search and position band chips (All · Top 3 · Top 10 · Top 30 · Not found · Cannibalized).
The Cannibalized filter shows the keywords for which, in the last 30 days, Google alternated at least two different URLs of the site, each seen in at least two checks: in the table they carry the ⇄ N URLs badge next to the name. A URL that appeared only once does not count, and checks without a URL are excluded; the count is separate for desktop and mobile.
The table
One row per keyword. Columns (order may vary if you have analytics connected):
| Column | Contents |
|---|---|
| Keyword | Query text (sortable A↔Z) |
| Previous (date) | Position at the previous detection for the active device |
| Current (date) | Position at the latest detection + small delta vs previous (sortable) |
| Sessions (Ng) | Organic sessions on the landing page in the period — only if GA4 or Matomo connected |
| Conv. rate | Landing page conversion rate in the period — only if analytics connected |
| Ranking URL | URL ranking in SERP at the latest detection, shown as a clickable 🔗 icon — opens the URL in a new tab; the full address appears on hover |
| Intent | Search intent of the query, as a coloured badge: I Informational · N Navigational · C Commercial · T Transactional (hover for full name + short explanation) |
| Volume | Average monthly searches (sortable) |
| Difficulty | 0–100, higher = more competitive (sortable) |
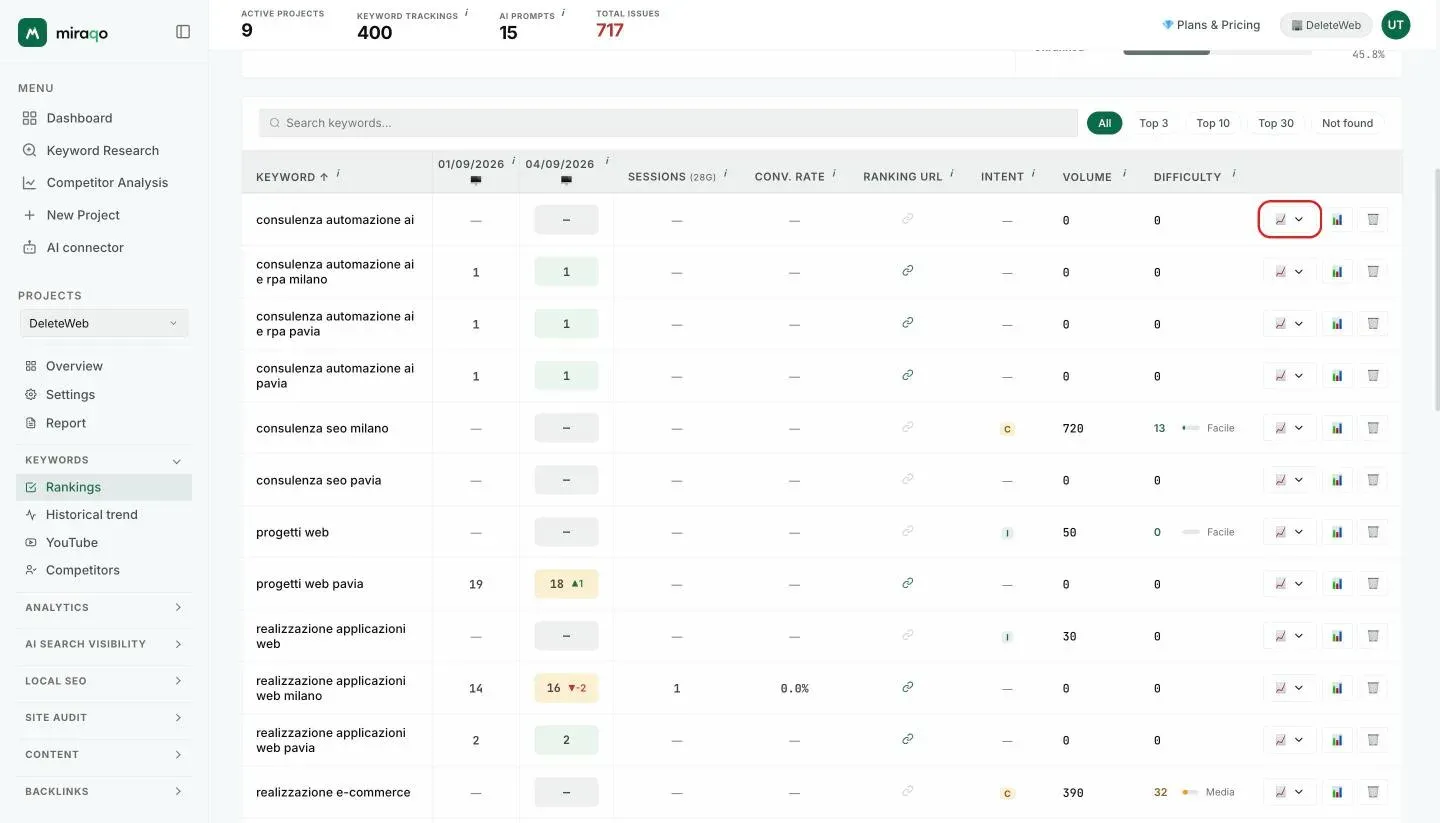
| Actions | 📈 View trend (opens a mini history chart inside the row) · 📊 Details (opens Single keyword detail) · 🗑 Remove (with confirmation) |
Sessions / Conv. rate metrics are aggregated per page, not per query: the same landing page may receive traffic from multiple keywords.
Inline trend mini-chart
The 📈 View trend button expands a position-history chart right under the row — without leaving the page. Above it you’ll find the range chips 7D · 1M · 3M · 6M · 1Y · 2Y; the chart follows the active device selected at the top. Another click and it collapses (the arrow rotates).
Single keyword detail
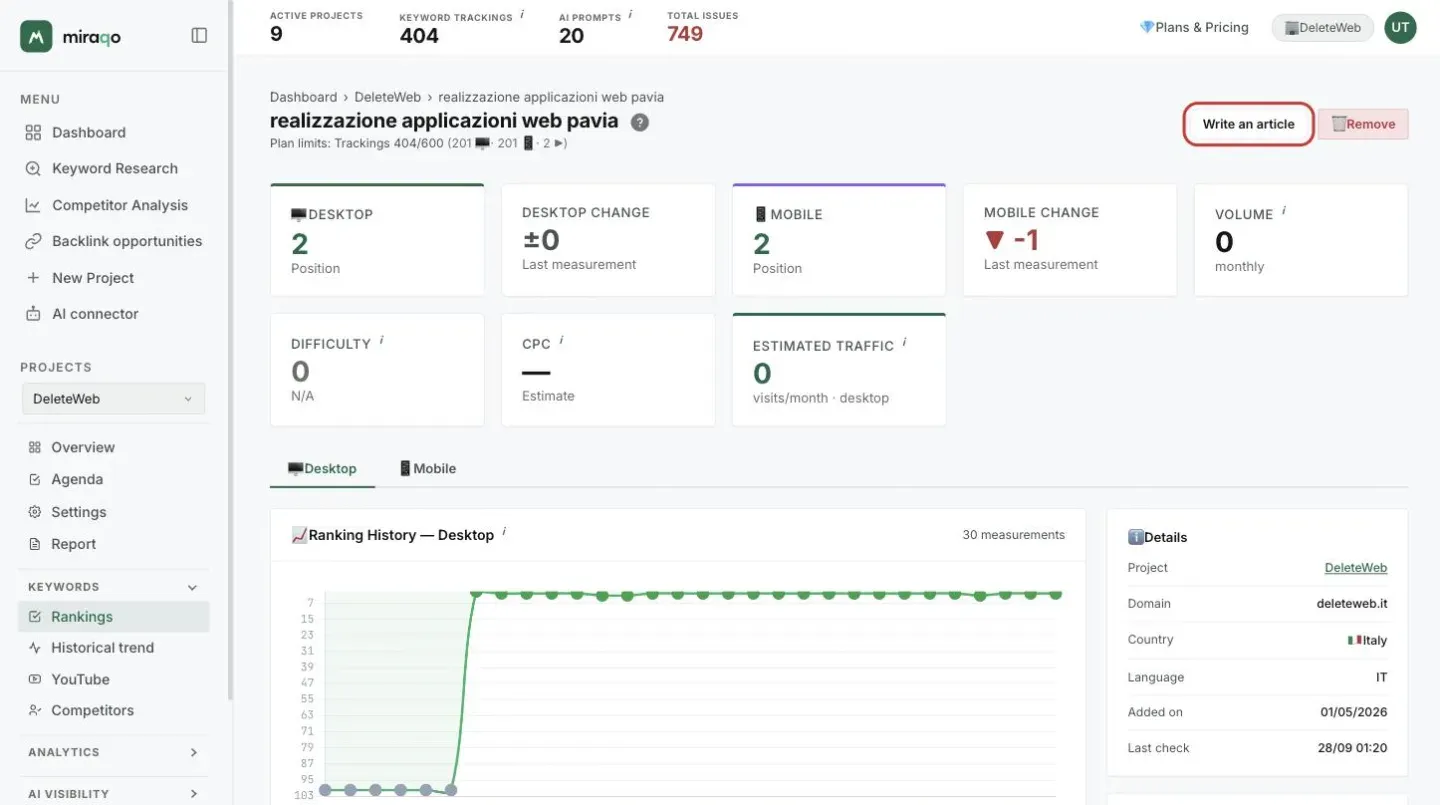
Click the row (or the 📊 icon) to open the keyword’s dedicated page. Top right you’ll find Write an article, which opens the Content generator with this keyword already filled in (requires the add-on), and the 🗑 Remove button (with confirmation).
Stat cards
Eight summary cards:
- 🖥 Desktop — current position (coloured: green Top 3, blue Top 10, grey beyond)
- Desktop Change — ▲▼ vs last previous detection
- 📱 Mobile — current position
- Mobile Change — ▲▼
- Volume — monthly searches
- Difficulty — /100 score with label (Easy / Medium / Hard / Very hard) and colour
- CPC — average Google Ads cost per click (proxy for commercial value)
- Estimated Traffic — estimated visits/month based on the desktop position (volume × CTR by position; AI Overview reduces CTR for top positions)
Competing pages (cannibalization)
If the keyword carries the ⇄ N URLs badge, the Competing pages card appears above the tabs: for each device it lists the URLs that took turns in the last 30 days, with the number of checks in which each one appeared. When two or more pages of the site alternate for the same search, Google has no preferred answer and usually neither page performs as well as it could.
If you have connected Search Console, below it you also find the pages Google showed for that query in the last 28 days, with impressions, share, clicks and average position: it tells you how much the split weighs, while the tracker list tells you who was ahead at each check.
What to do: pick one landing page and point internal links there, or merge the pages into one. There is no list based on Search Console alone: cannibalized queries you do not track yet show up under “Untracked queries” in the project Overview; once added to your keywords, the badge flags them from the next check.
Desktop and Mobile tabs
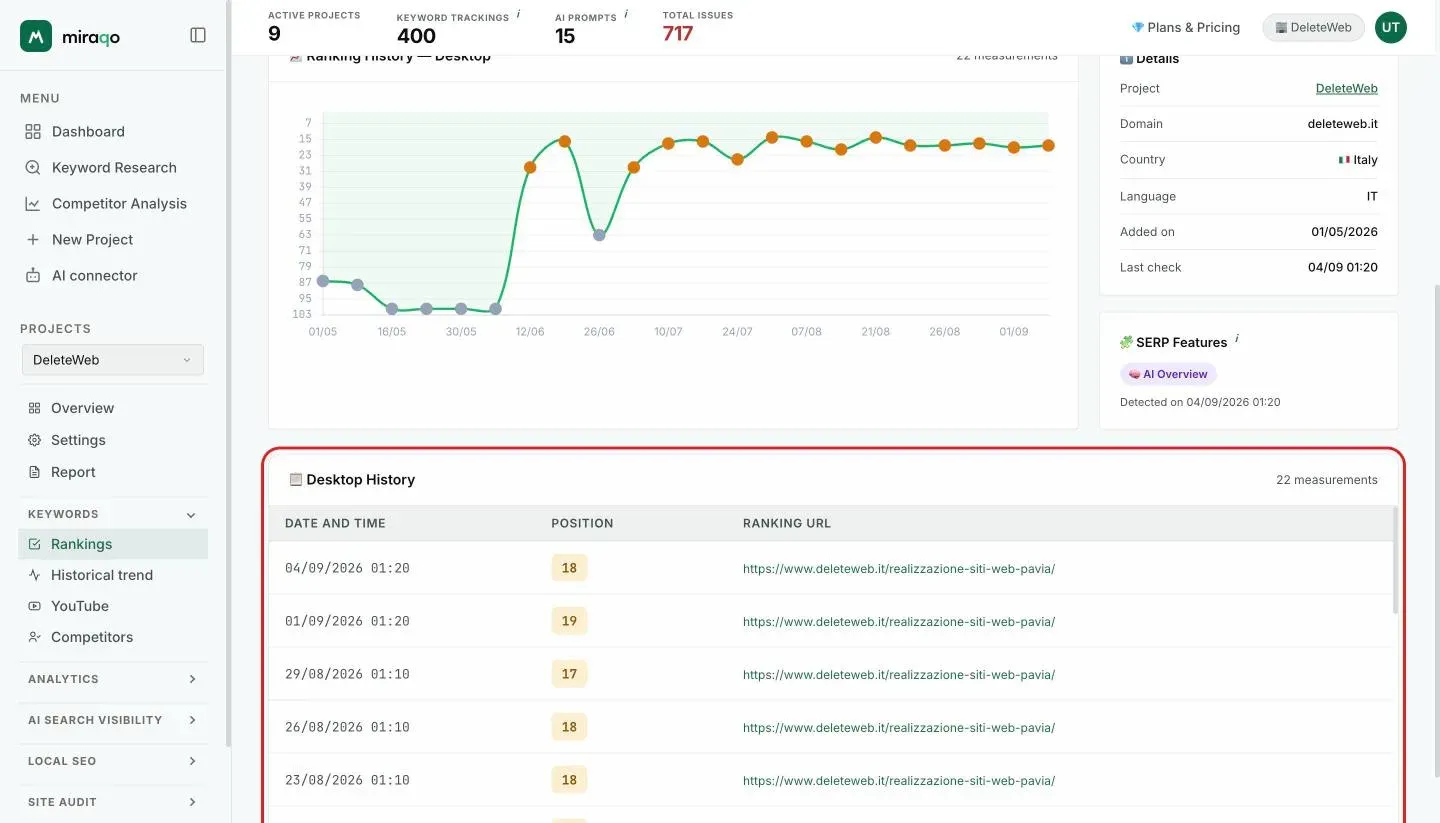
Two tabs, one per device, below the stat cards. In each you’ll find the 📈 Position history (time chart, inverted Y axis: rising = improving) and the 📋 History, the detection table with date and time, position and ranking URL. On the right, the Details panel (project, domain, country, language, date added, last check) and the SERP Features detected at the last check.
“I see myself first on Google, but not here”: why positions can differ
You may search a keyword on Google, find yourself in a certain position and read a different number in Miraqo, sometimes a very different one. Neither side is wrong. They are two measurements taken under different conditions.
How Miraqo measures. Every check starts from neutral conditions that never change: the country and language chosen for the keyword, the device (Desktop or Mobile), no Google account, no search history, no specific city. It is the position an “average” user in that country would see.
How you measure. Your browser tells Google where you are, even in a private window, because the area is derived from your connection. On top of that, Google takes into account your previous searches and the account you are signed in with. If you search for your company name from the city where it is based, it is normal to see yourself higher than the rest of the country does.
The differences are larger in three cases:
- New sites. In the first months Google moves pages in and out of the results and shifts them by dozens of positions within hours. Two searches made a short time apart can give results that are far from each other. Over time the positions settle.
- Brand name searches, especially when the name is new or shared with other sites.
- Local searches (“dentist”, “restaurant”): people nearby see one result, people far away see another. To measure them point by point there is the Local ranking map.
Which number to look at. The value of Miraqo’s data is that it is always taken under the same conditions: that is why the trend over time is comparable, while a manual search is not. To know how real users see you, connect Search Console: the average position it reports is calculated on real searches, from every place. The two measurements are read together. Miraqo tells you where you stand for the country, Search Console tells you where the people who searched actually saw you.
Managing keywords (from Settings)
In Settings → Keywords, below the addition form, you’ll find 🔑 Keyword Management: a table of all project keywords with:
- Checkbox for multiple selection → 🗑 Delete selected at the bottom
- Country in inline dropdown (change without reloading)
- Status — Active (green) or Inactive (grey) pill
- Actions — ⏸ Deactivate / ▶️ Reactivate · 🗑 Delete (individual, with confirmation)
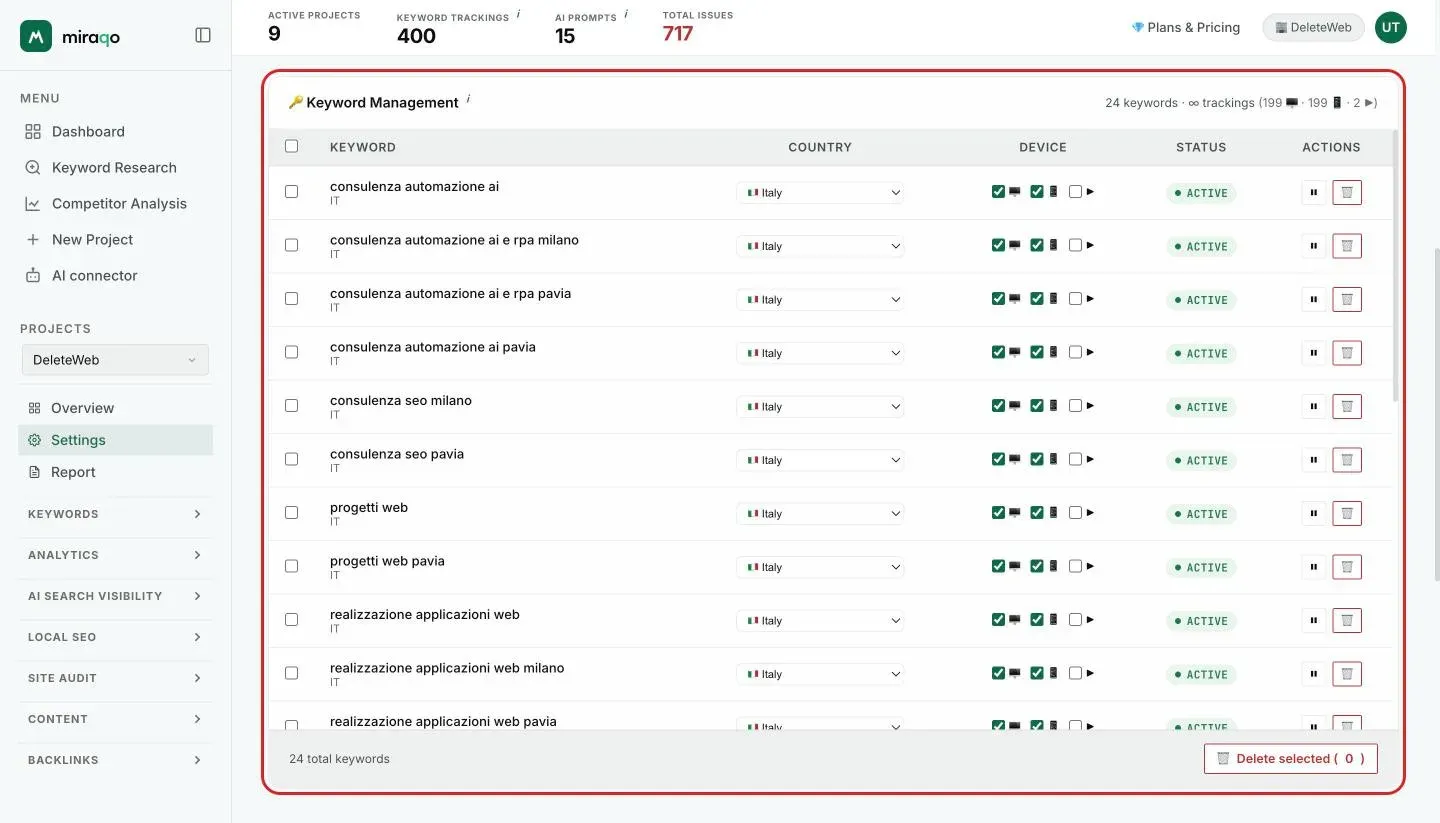
Deactivating ≠ deleting. An inactive keyword retains its history but is no longer tracked and doesn’t occupy a “re-creation slot” if you decide to reactivate it. It’s the right choice for a temporary pause without losing data.
Anti-abuse: removing a keyword doesn’t immediately free up the plan slot. The slot remains occupied for 30 days after removal, to prevent consuming quota by cycling additions and deletions. If you just want to “pause” it, use deactivation — it preserves history and reactivates whenever you want.
Last updated: 30 September 2026